
The best way to really get to know a tool is by seeing how far you can push it. In other words, innovating.
When the team here at Glide was developing the research that became the Innovators at Work Assessment, we knew we wanted to create a quiz that would help others understand what type of Innovator they were. While the team floated ideas of using a form builder or other app, I insisted on figuring out how to do it in Glide.
While Glide isn’t designed to be a quiz app, it is designed to be flexible and powerfully adaptable, specifically around data. A quiz is essentially a way of collecting and analyzing data to produce a result. We’d never done this before, but I had an idea of how we could pull it off.
This is how I pushed my use of Glide and discovered new ways for it to meet my needs. The resulting quiz and reporting apps work elegantly. Their structure could be applied to many different uses at work—from employee surveys to customer analytics to building your own personality assessment.
Here’s a breakdown of each step so you can build your own or try something new with Glide.
Building the prototype
The quiz logic was already figured out before I began working on the app. We put together the first prototype right before the holidays using that logic. It was a single-page app that displayed results when the form was submitted.
We can make it better, we have the technology
In January, as we neared the launch date, we wanted to make some changes to the UX. The single-page form wasn’t very engaging. We wanted a multi-step experience that would take the user on a journey. Something that would give them the space to think more deeply about their answers.
I had an idea of how to do it. So I tried. And tried. And tried. Nothing worked. The clock was ticking. We were running out of time.
The eleventh hour approached. Deadline was on our doorstep. So I did what any reasonable developer would do.
I blew it up and started over.
I’ll tell you how we did it, but first, let's look at the app.
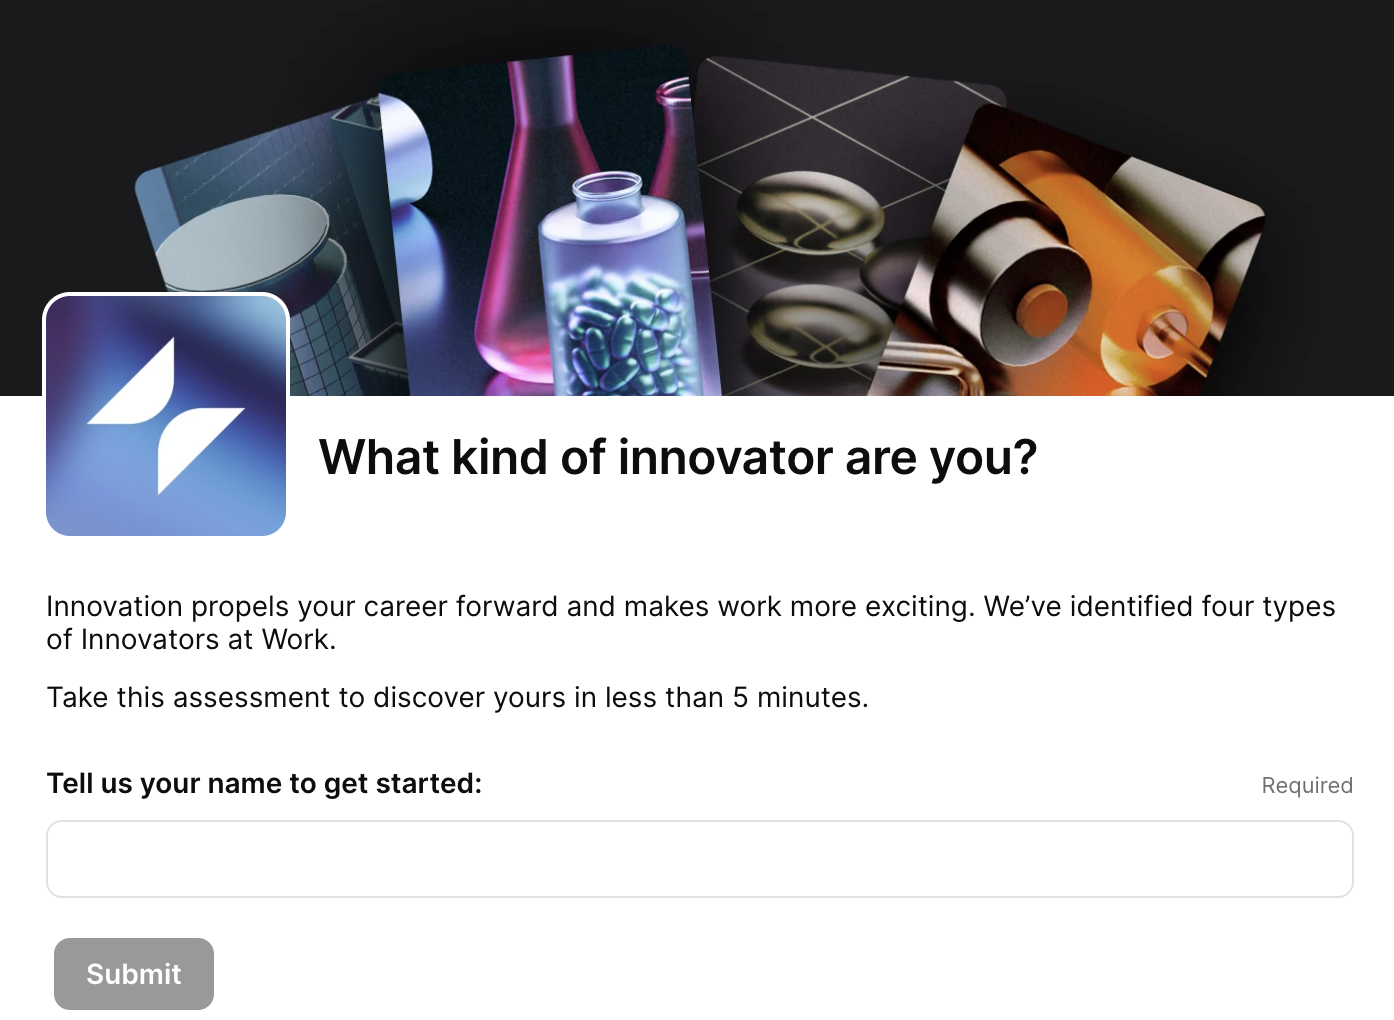
Taking the assessment
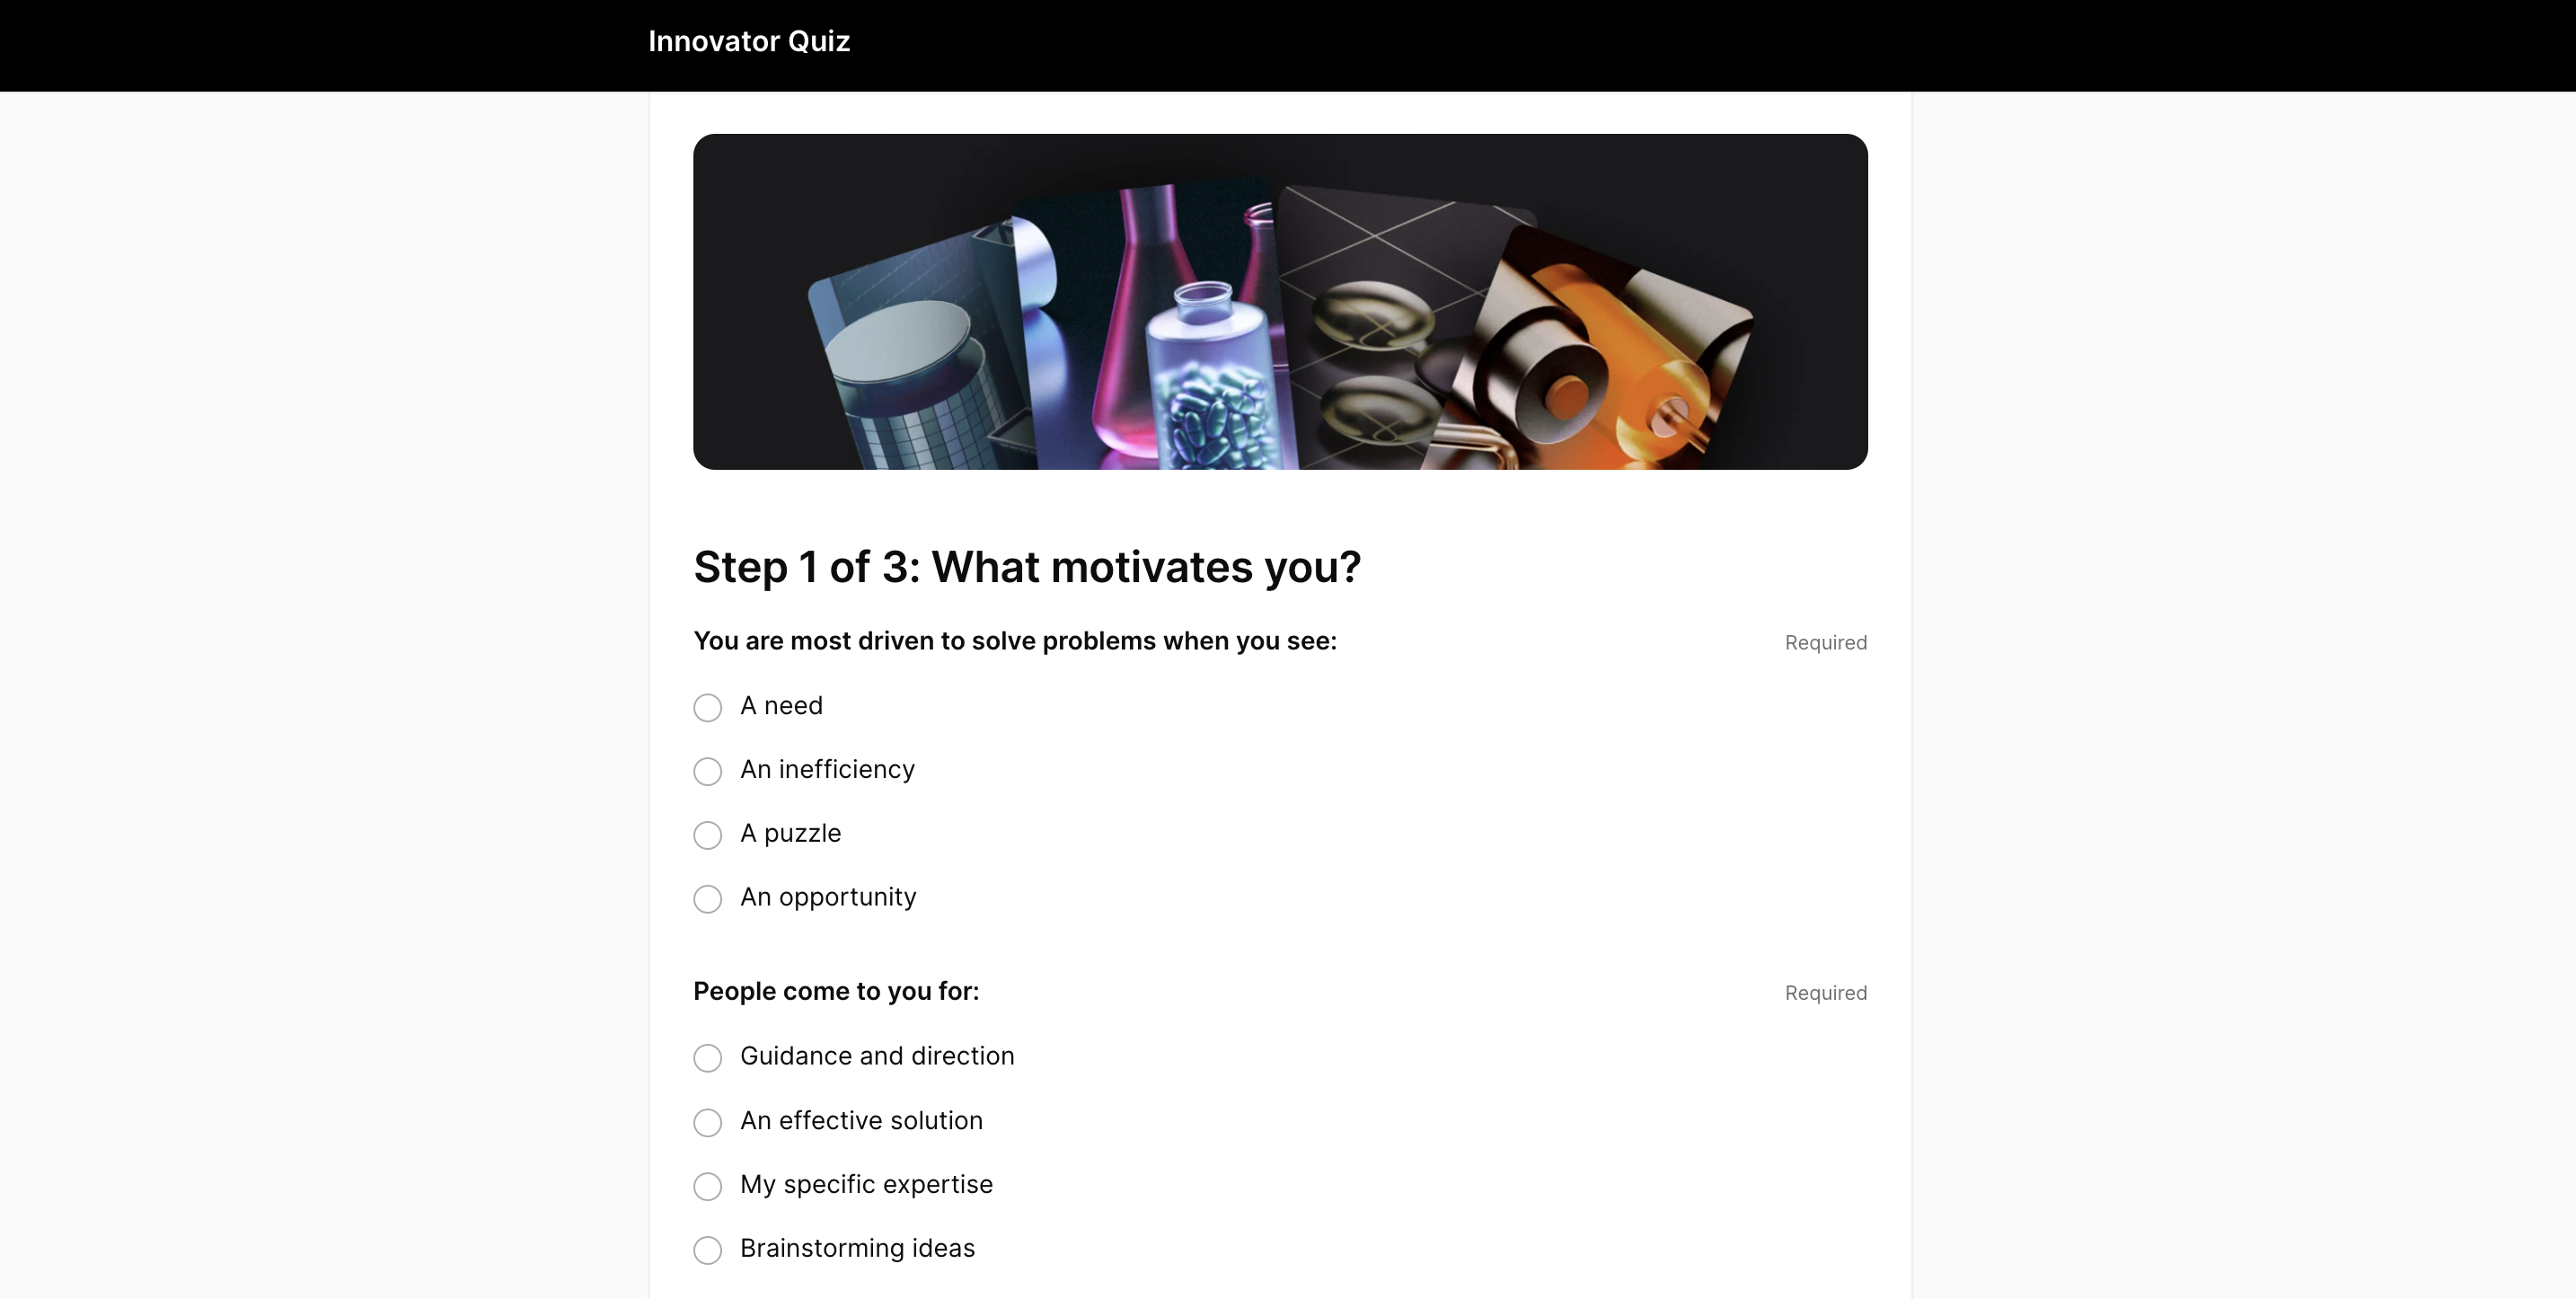
When you land on the assessment page, you’re looking at a Glide app. You start the assessment and progress through a series of questions. The answer order is randomized so that your results aren’t skewed by a recognizable pattern.
When you complete the assessment, you’re shown your Innovator Type, with rich details. We email you a copy of your results and invite you to learn more about the different Innovator Types. (You can learn about each one in our blog post.)
When you view your results, you are also prompted to share the results on social. We invited Gliders to take the assessment and share their Innovator Type results as part of our Innovators at Work community challenge.
So how did we build it? Let’s break it down.
The Innovators Quiz is a Glide app running on a Business plan. We’re using native Glide features, including Glide AI, for everything. The app is set to Public, which means we’re not dealing with user limits. We are, however, consuming a ton of updates.
Data
We use five Glide Tables for our data:
- Quiz Questions
- Quiz Segmentation
- Innovator Types
- Quiz Responses
- Completed Assessments
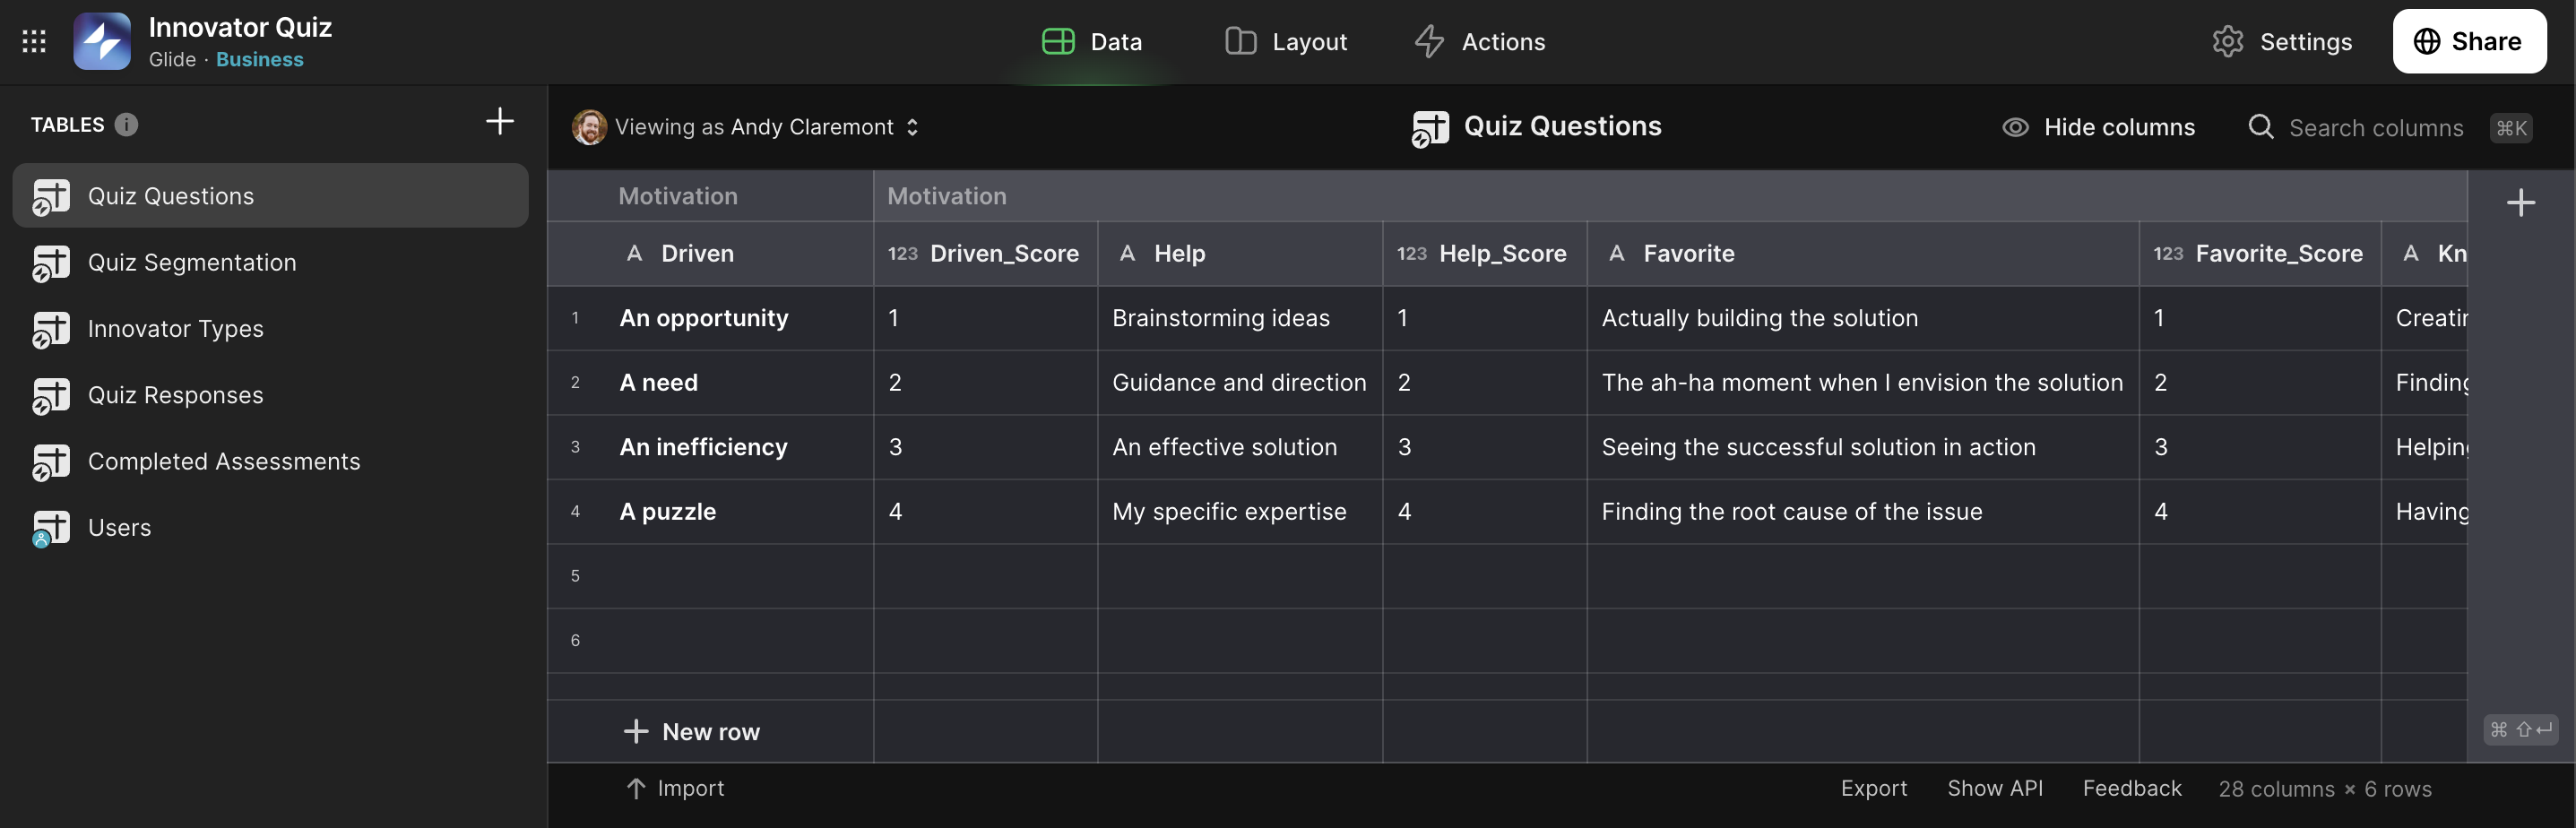
Quiz Questions lists all the answer options, grouped by question. Each answer is a key:value pair. The key is the answer text, while the value is the score. Our layout references this table for each question; more on that in a moment.
Quiz Segmentation is a helper table for our assessment reporting. Helper tables are a way to store data for repeated referencing in your app. Each column corresponds to answers for one of the segmentation questions at the end of the quiz. For example, we ask you about your role and company. This comes in handy when we’re summarizing results and gathering insights.
Innovator Types is another helper table for displaying results. There’s a row for each of the four Innovator Types. Columns store the different types of information we need to display in the results. For example, we store the Innovator Type name, image, description, and social sharing text in this table.
Quiz Responses is where the magic happens. When you start the quiz, you’re actually adding a new row to Quiz Responses. As you progress through the quiz, you’re updating values for that row you added. We use those values to determine your Innovator Type. Then, based on the result, we use relations and lookups to pull the corresponding result details and display them to you at the final step of the assessment. This table is a beast because it includes all assessments, both complete and incomplete
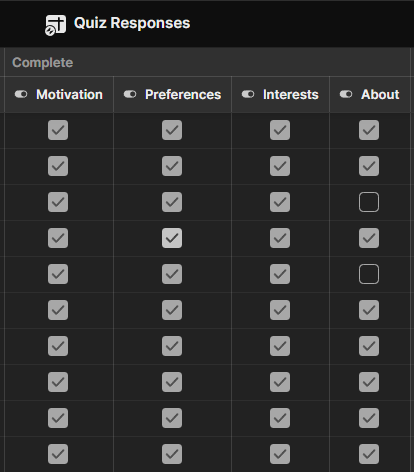
Completed Assessments holds only completed assessments. It includes the Row ID of the completed assessment, a relation column based on the row ID, and a timestamp marking when the assessment was completed. This is the table we reference for our reporting. It lets us pull all the details we need from the Quiz Responses table, so we’re not duplicating data or consuming more updates than we need to.
Layout
We only use two pages in this app: Quiz and Quiz Results.
Quiz Results is only visible in the builder, and we only use it for troubleshooting the app, so we won’t waste time talking about that. Instead, let’s talk about the Quiz page; that’s where all the layout magic happens.
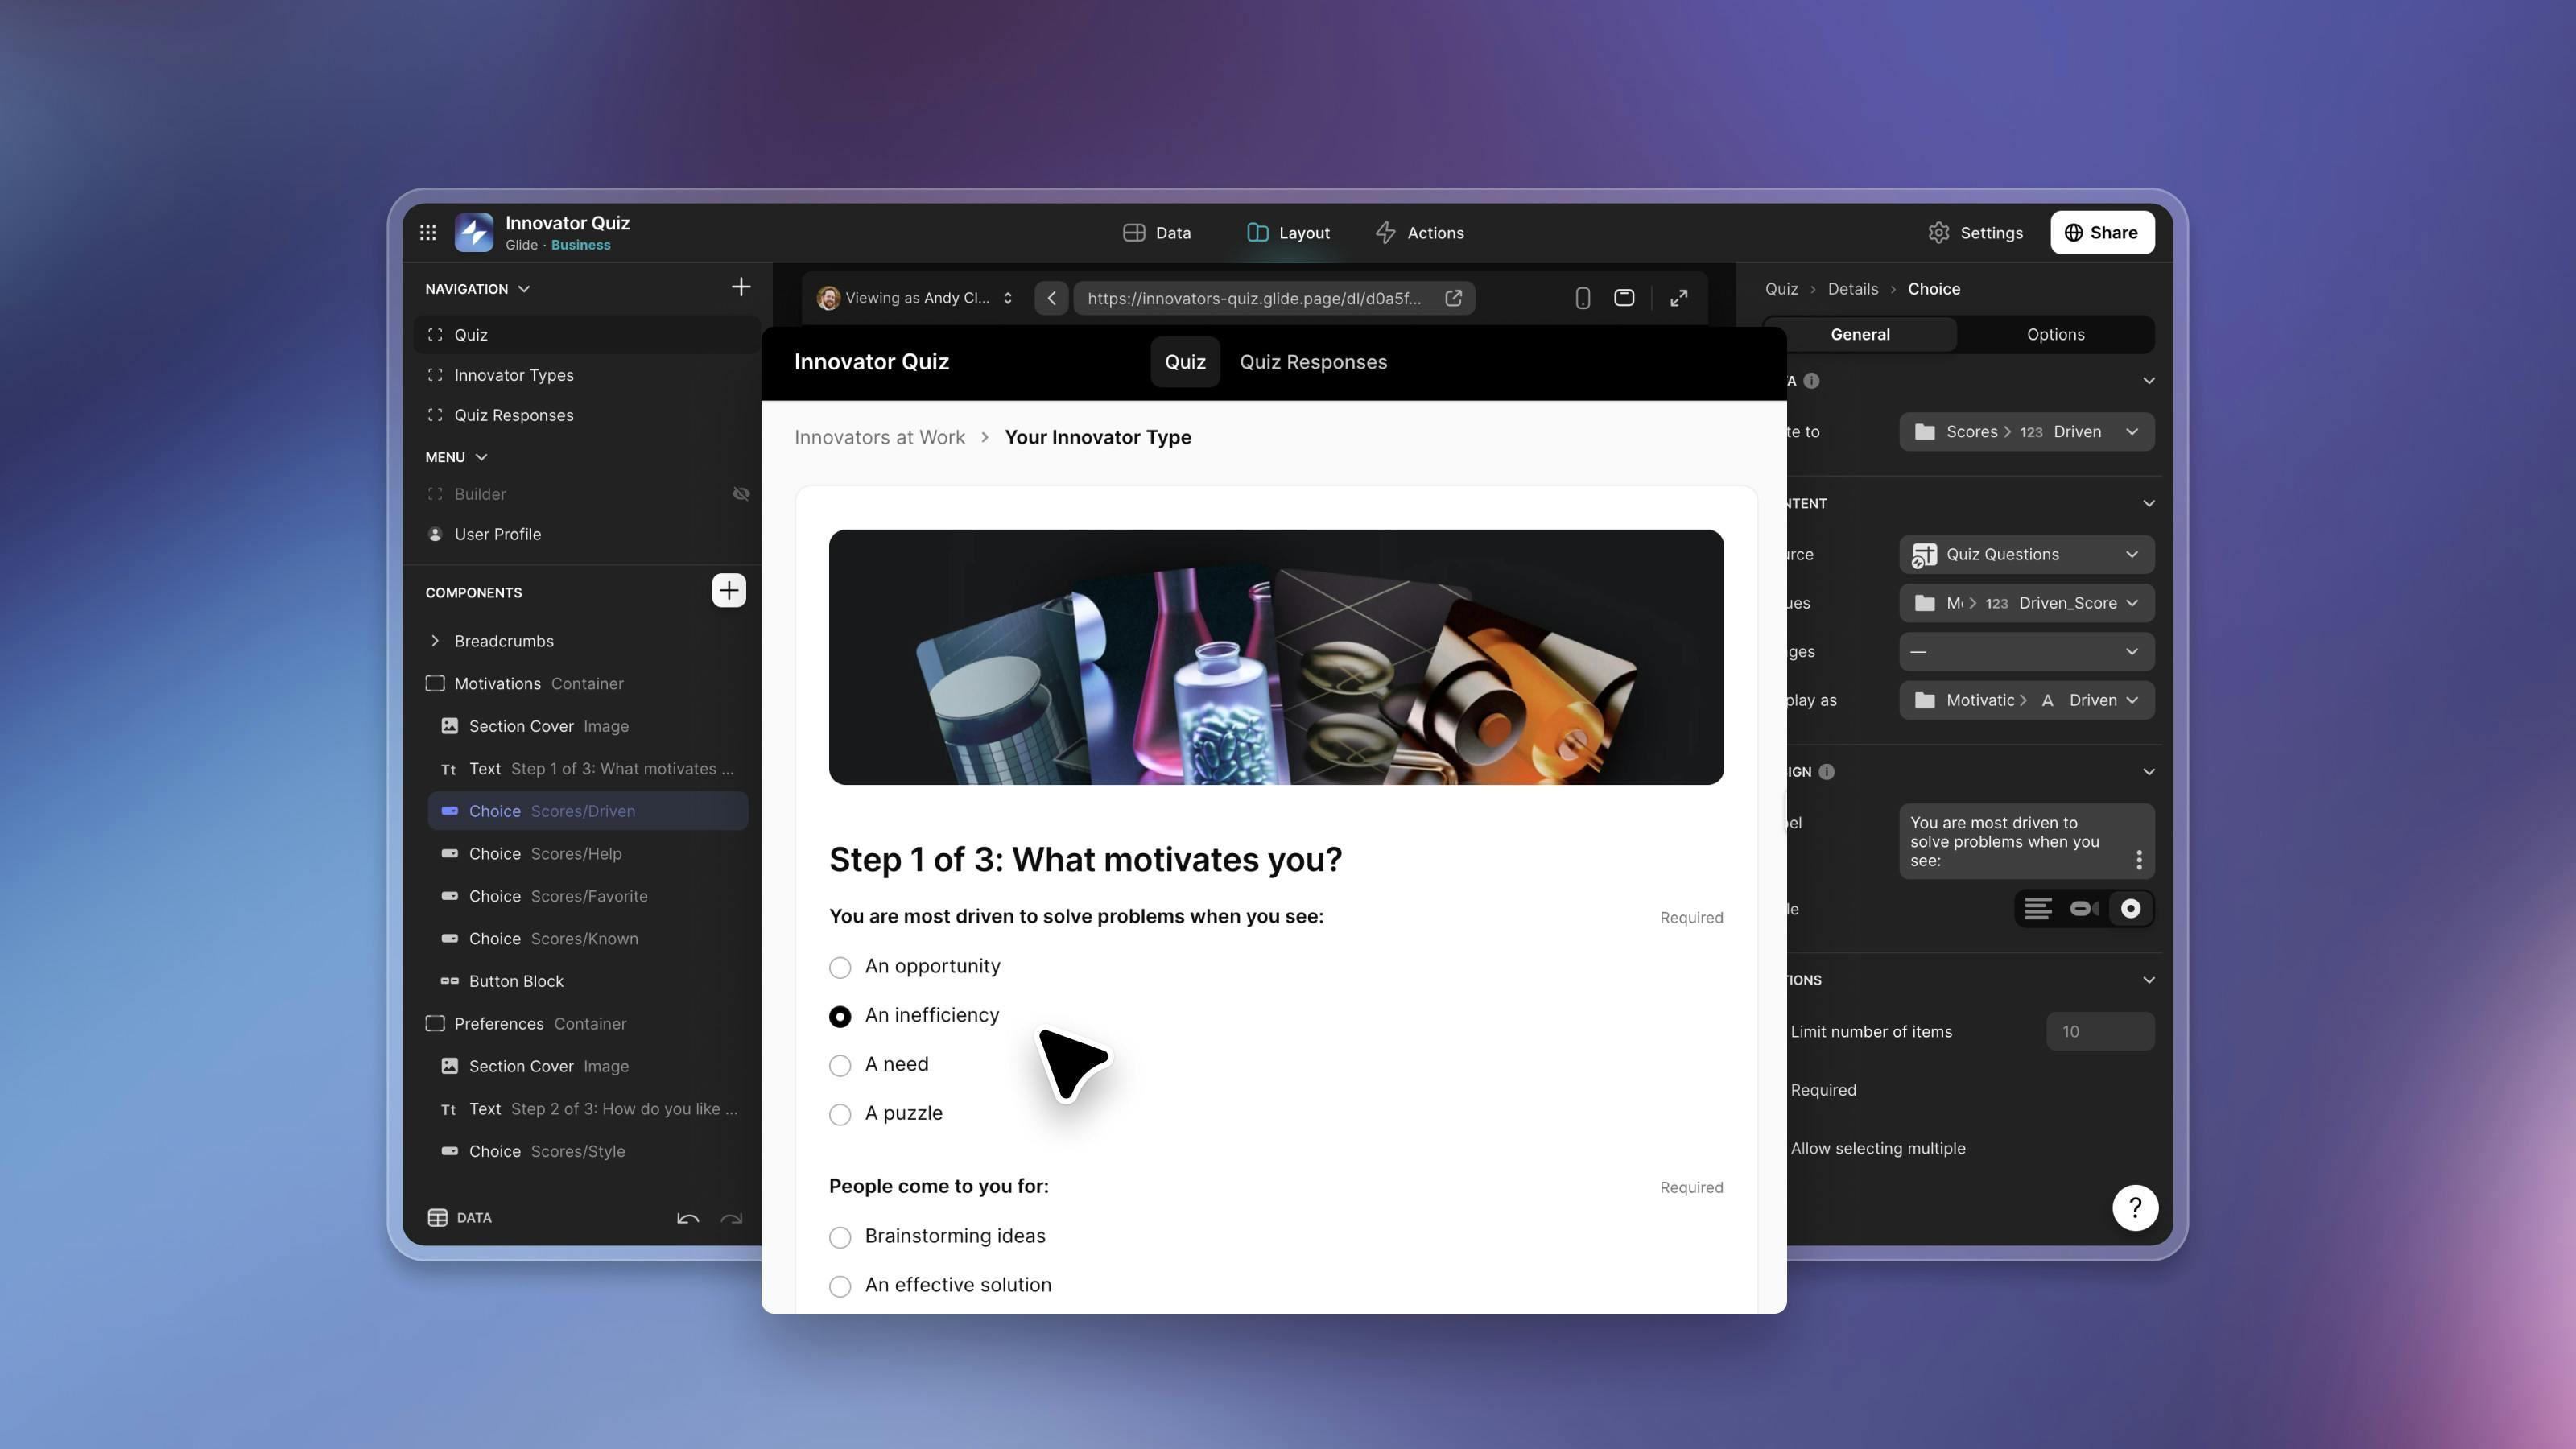
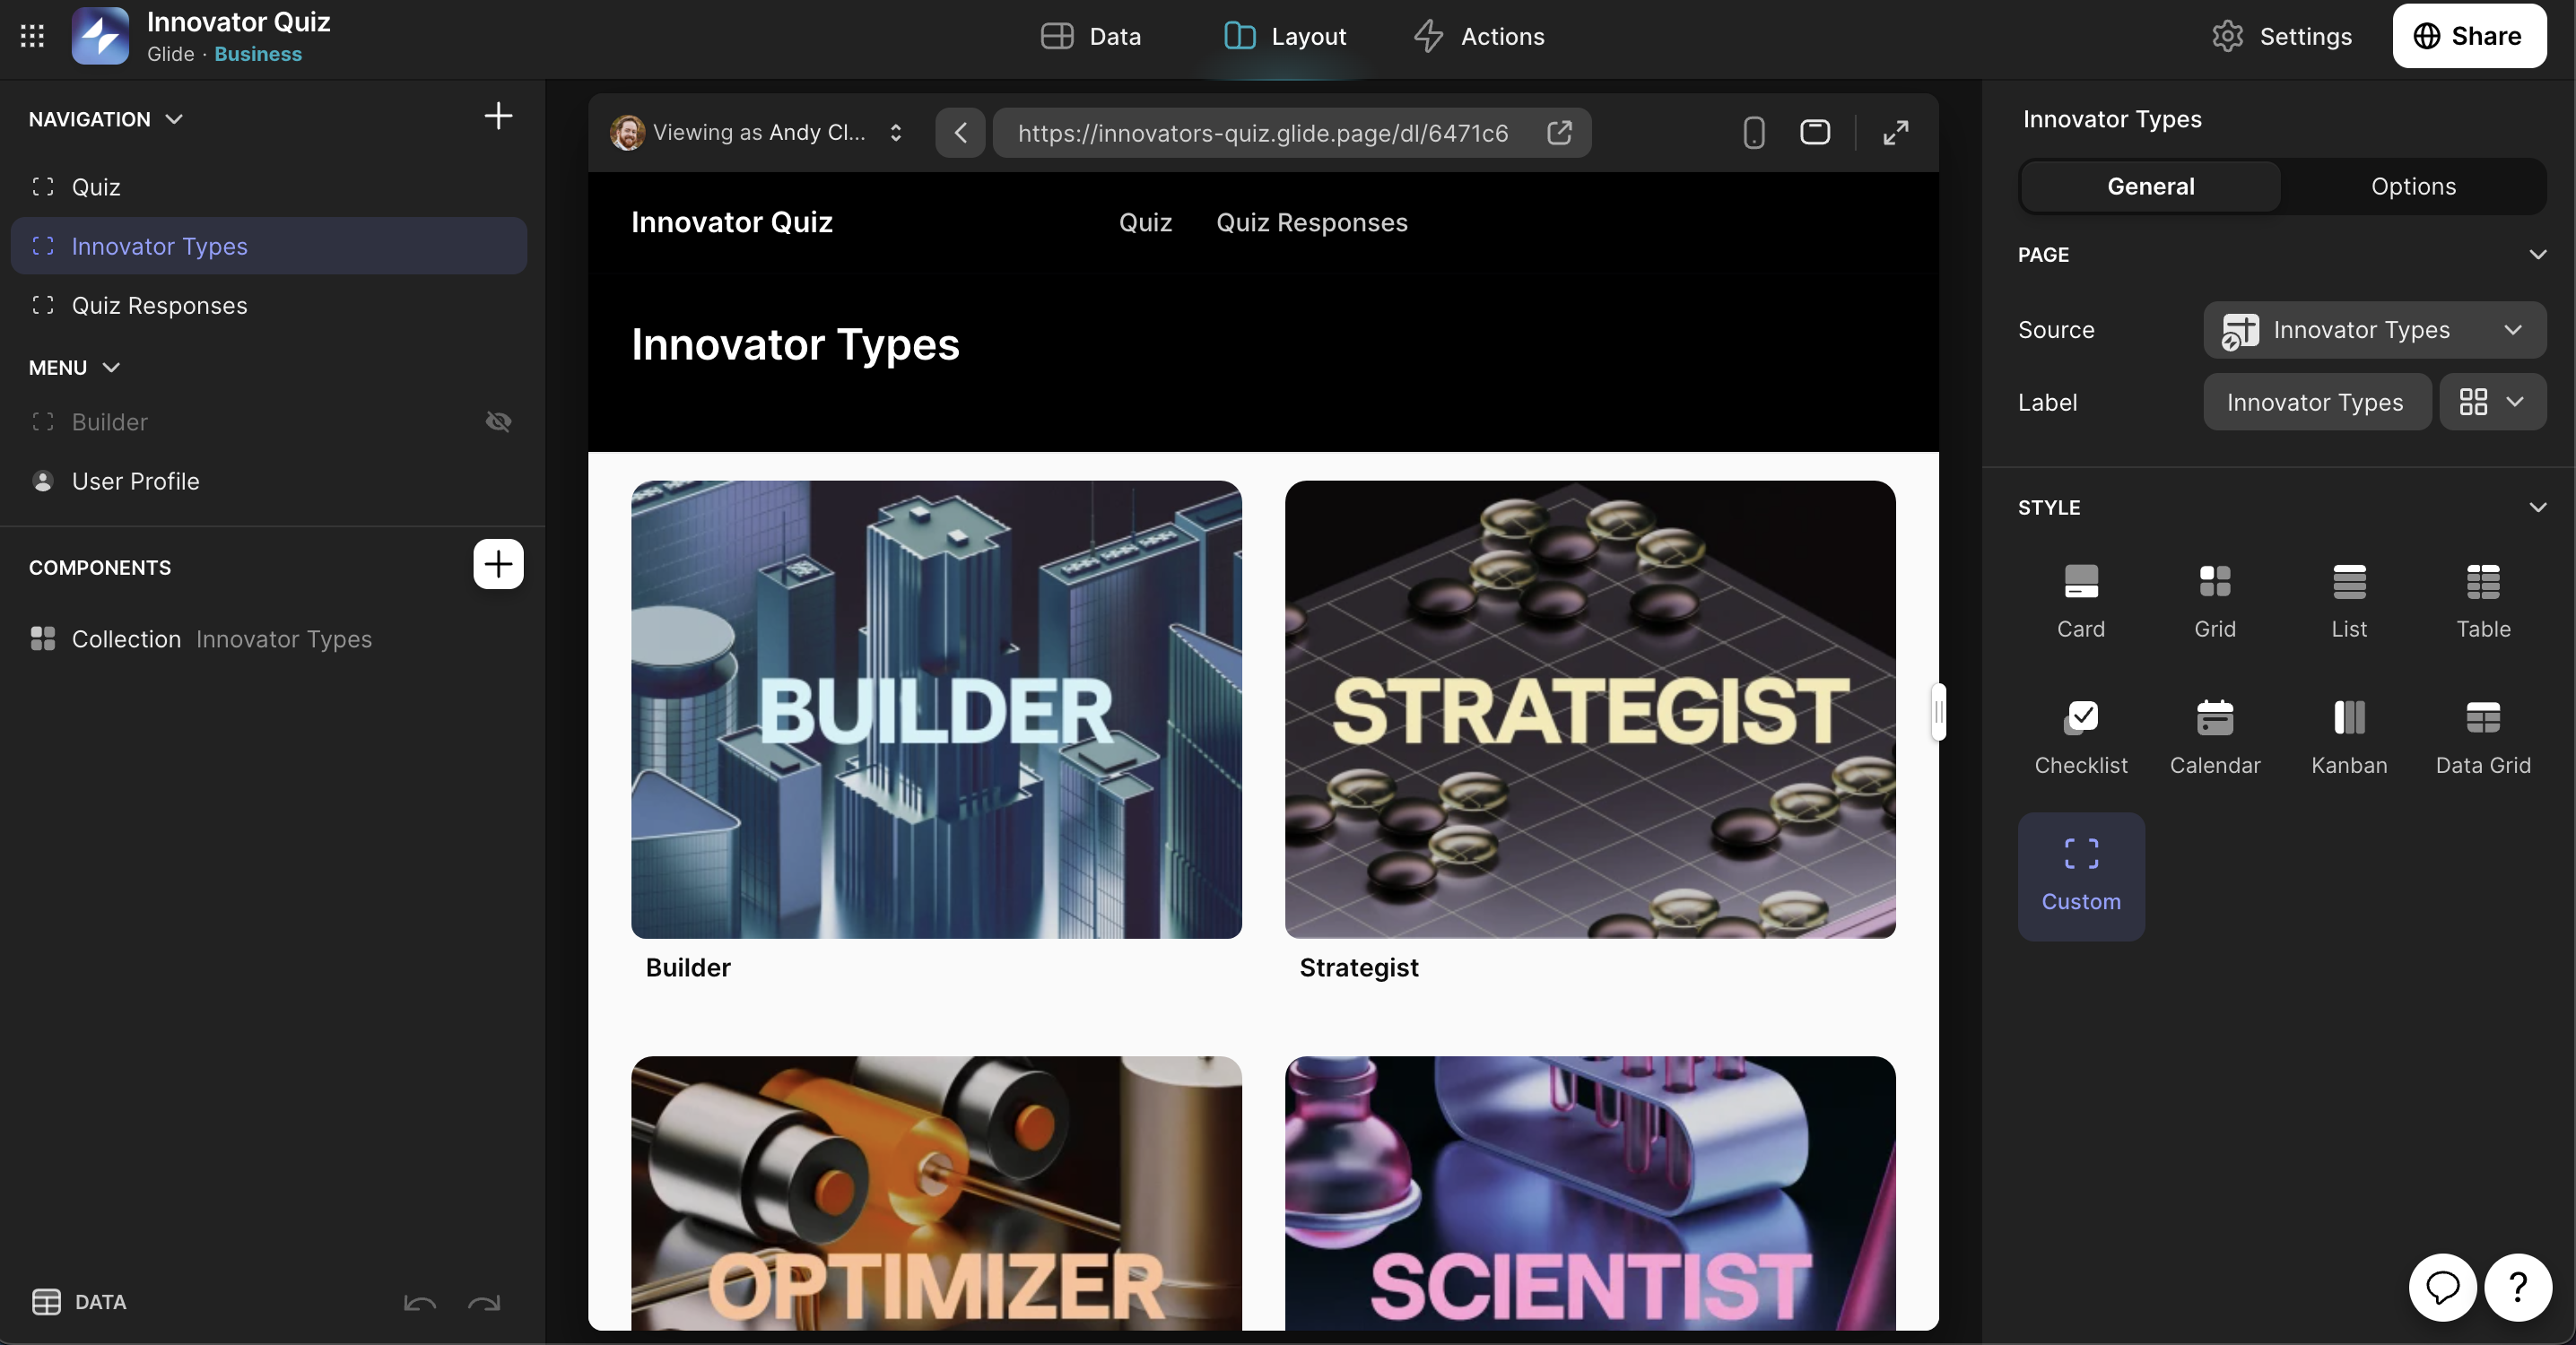
The Quiz page contains a single form container with a Title, Text, and Text Entry component. This serves as the landing page for the quiz. When you submit the form, you’re adding a new row to the Quiz Responses table. You’re then taken to the detail view for that row. The detail view is where we’re getting really clever.
We have a series of containers for each section of the quiz. Each container has visibility rules applied. The visibility rules check the Quiz Responses table for certain conditions. If those conditions are met, we display the corresponding container.
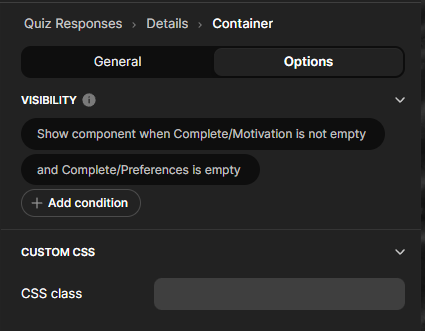
Each container includes a set of Choice components. The Choice components pull their values from the Quiz Questions data table. As you’re going through the quiz, you’re actually updating row values in a detail screen. Then, at the end of the quiz, we show the final container with your result displayed.
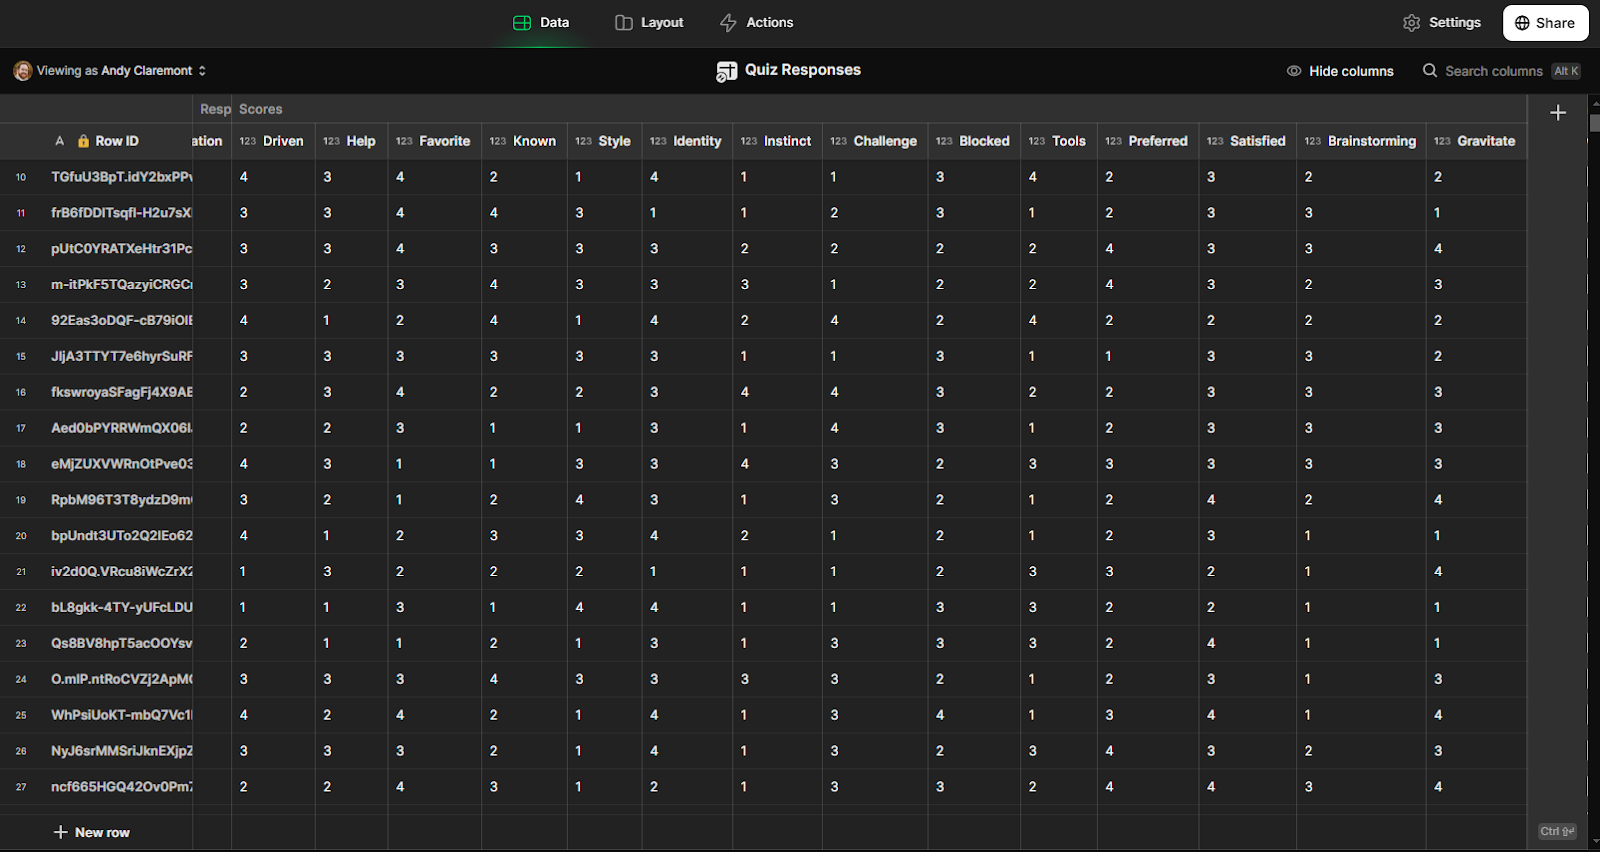
Question values are stored in the Quiz Responses table
How are we making it look like you’re going from page to page? Good question… we’re using Custom Actions, our final piece of magic.
Actions
We have a bunch of custom actions set up for this quiz:
- A set of actions handle progression through the quiz
- Another set of actions handle the social sharing
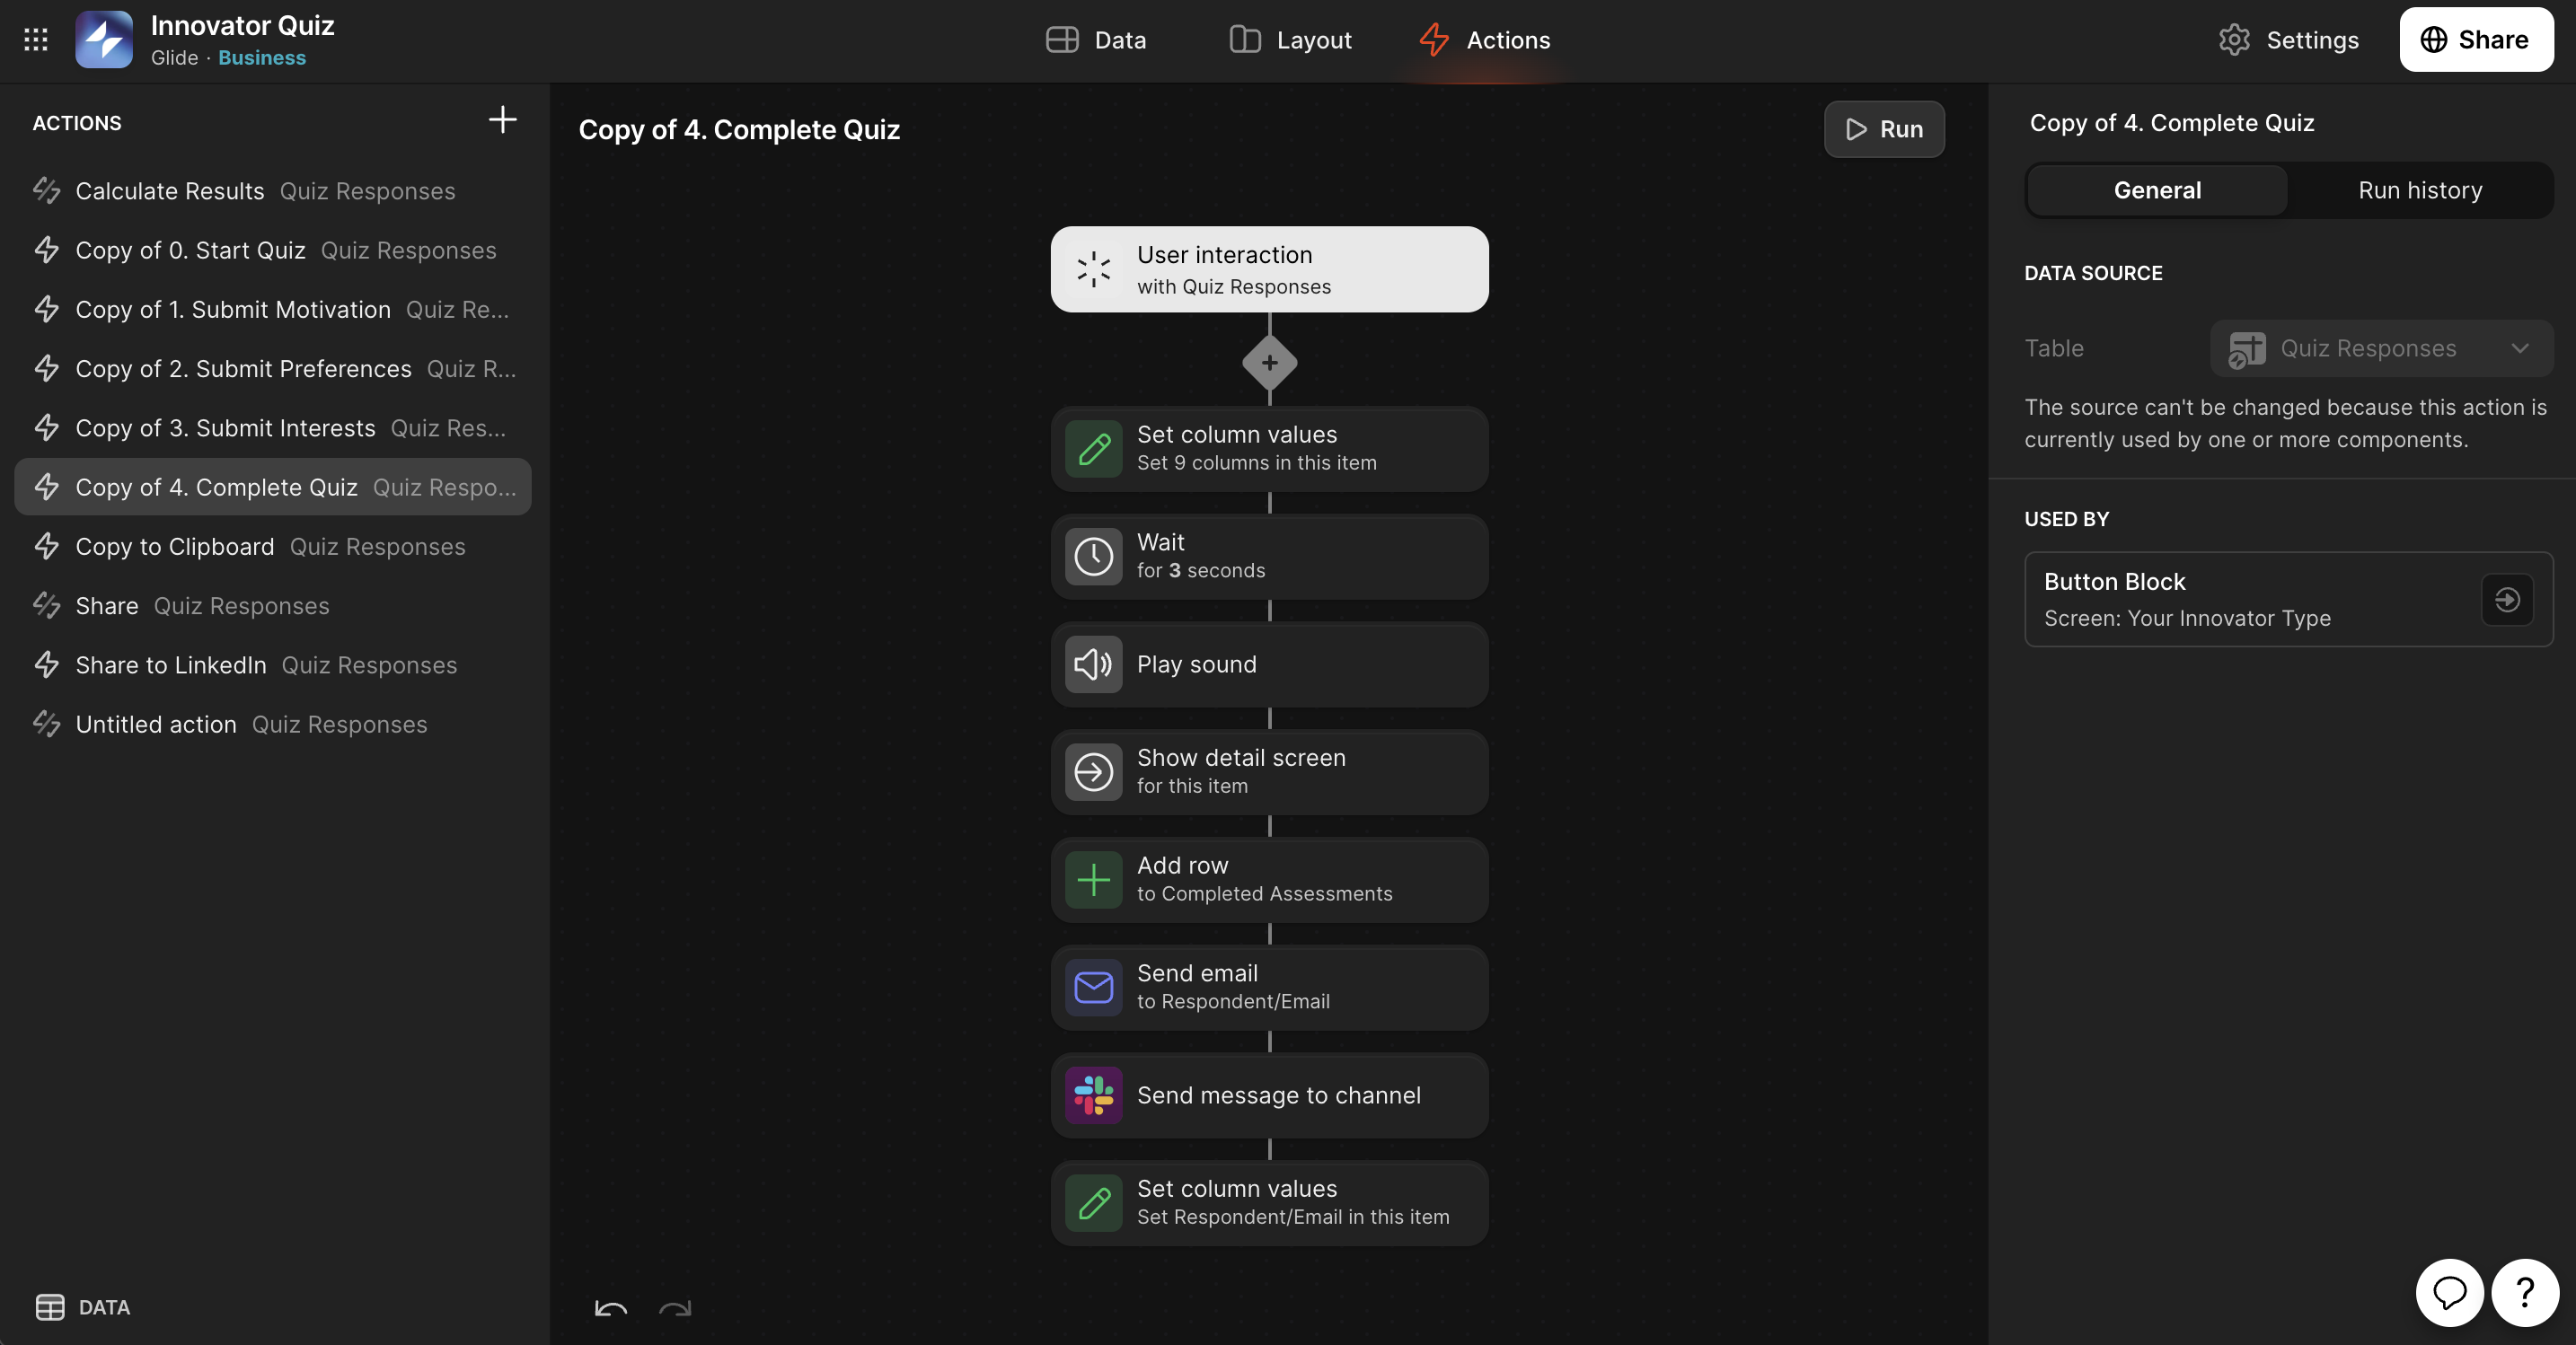
Let’s talk about the quiz progression actions first. When you start the quiz by submitting the form, you’re triggering a custom action. It simply shows the detail screen for the row you just created.
As you complete each section, we trigger a custom action to update row values. We set a boolean column indicating that the section is completed.
Using boolean columns to track quiz progression
Remember the visibility rules we applied to the containers on the detail screen? The visibility rules on the detail screen check these boolean columns. That’s how they know how far along you are in the assessment. We then use a navigation action to take you to the detail screen you’re already on. This creates the illusion that you’re going to a different screen.
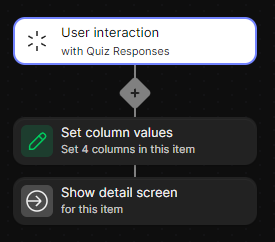
The final segmentation questions trigger another action. When you complete this section, we add an entry to the Completed Assessments table. We also combine your results into a single template column for the notification email. Then we use a Send Email action to send the results to whatever email you specified when you started the quiz.
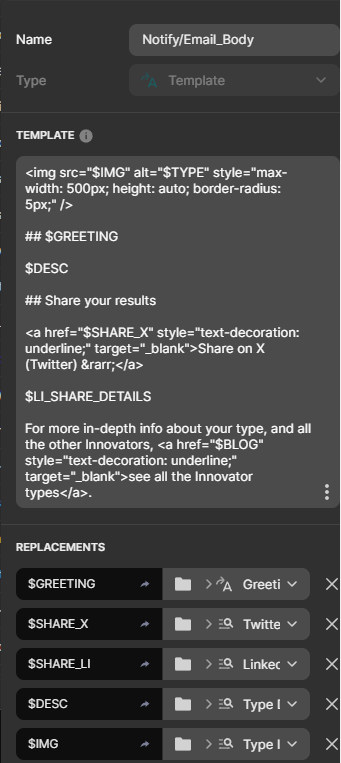
Template column generates the HTML for the email notification
Lastly, we have a custom action for sharing to LinkedIn. This opens a new screen with instructions for sharing your results to LinkedIn.
Calculating the results with AI
In early versions of the quiz, we were using a simple math formula to determine the results. We looked for the average score based on the responses chosen. We quickly realized that these weren’t very accurate.
We replaced that with a Glide AI computed column with a simple prompt: “What is the most repeated number in this column?”
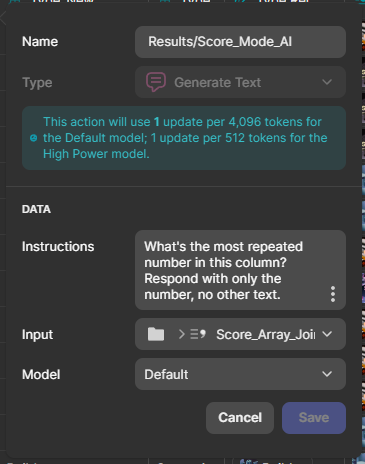
Glide AI column configured to return the most common score
That common score corresponds to an Innovator Type. Based on the calculated results, we use an If-Else column to set the Innovator Type and use Relation and Lookup columns to pull details from the Innovator Types table.
Monitoring the results with an admin app
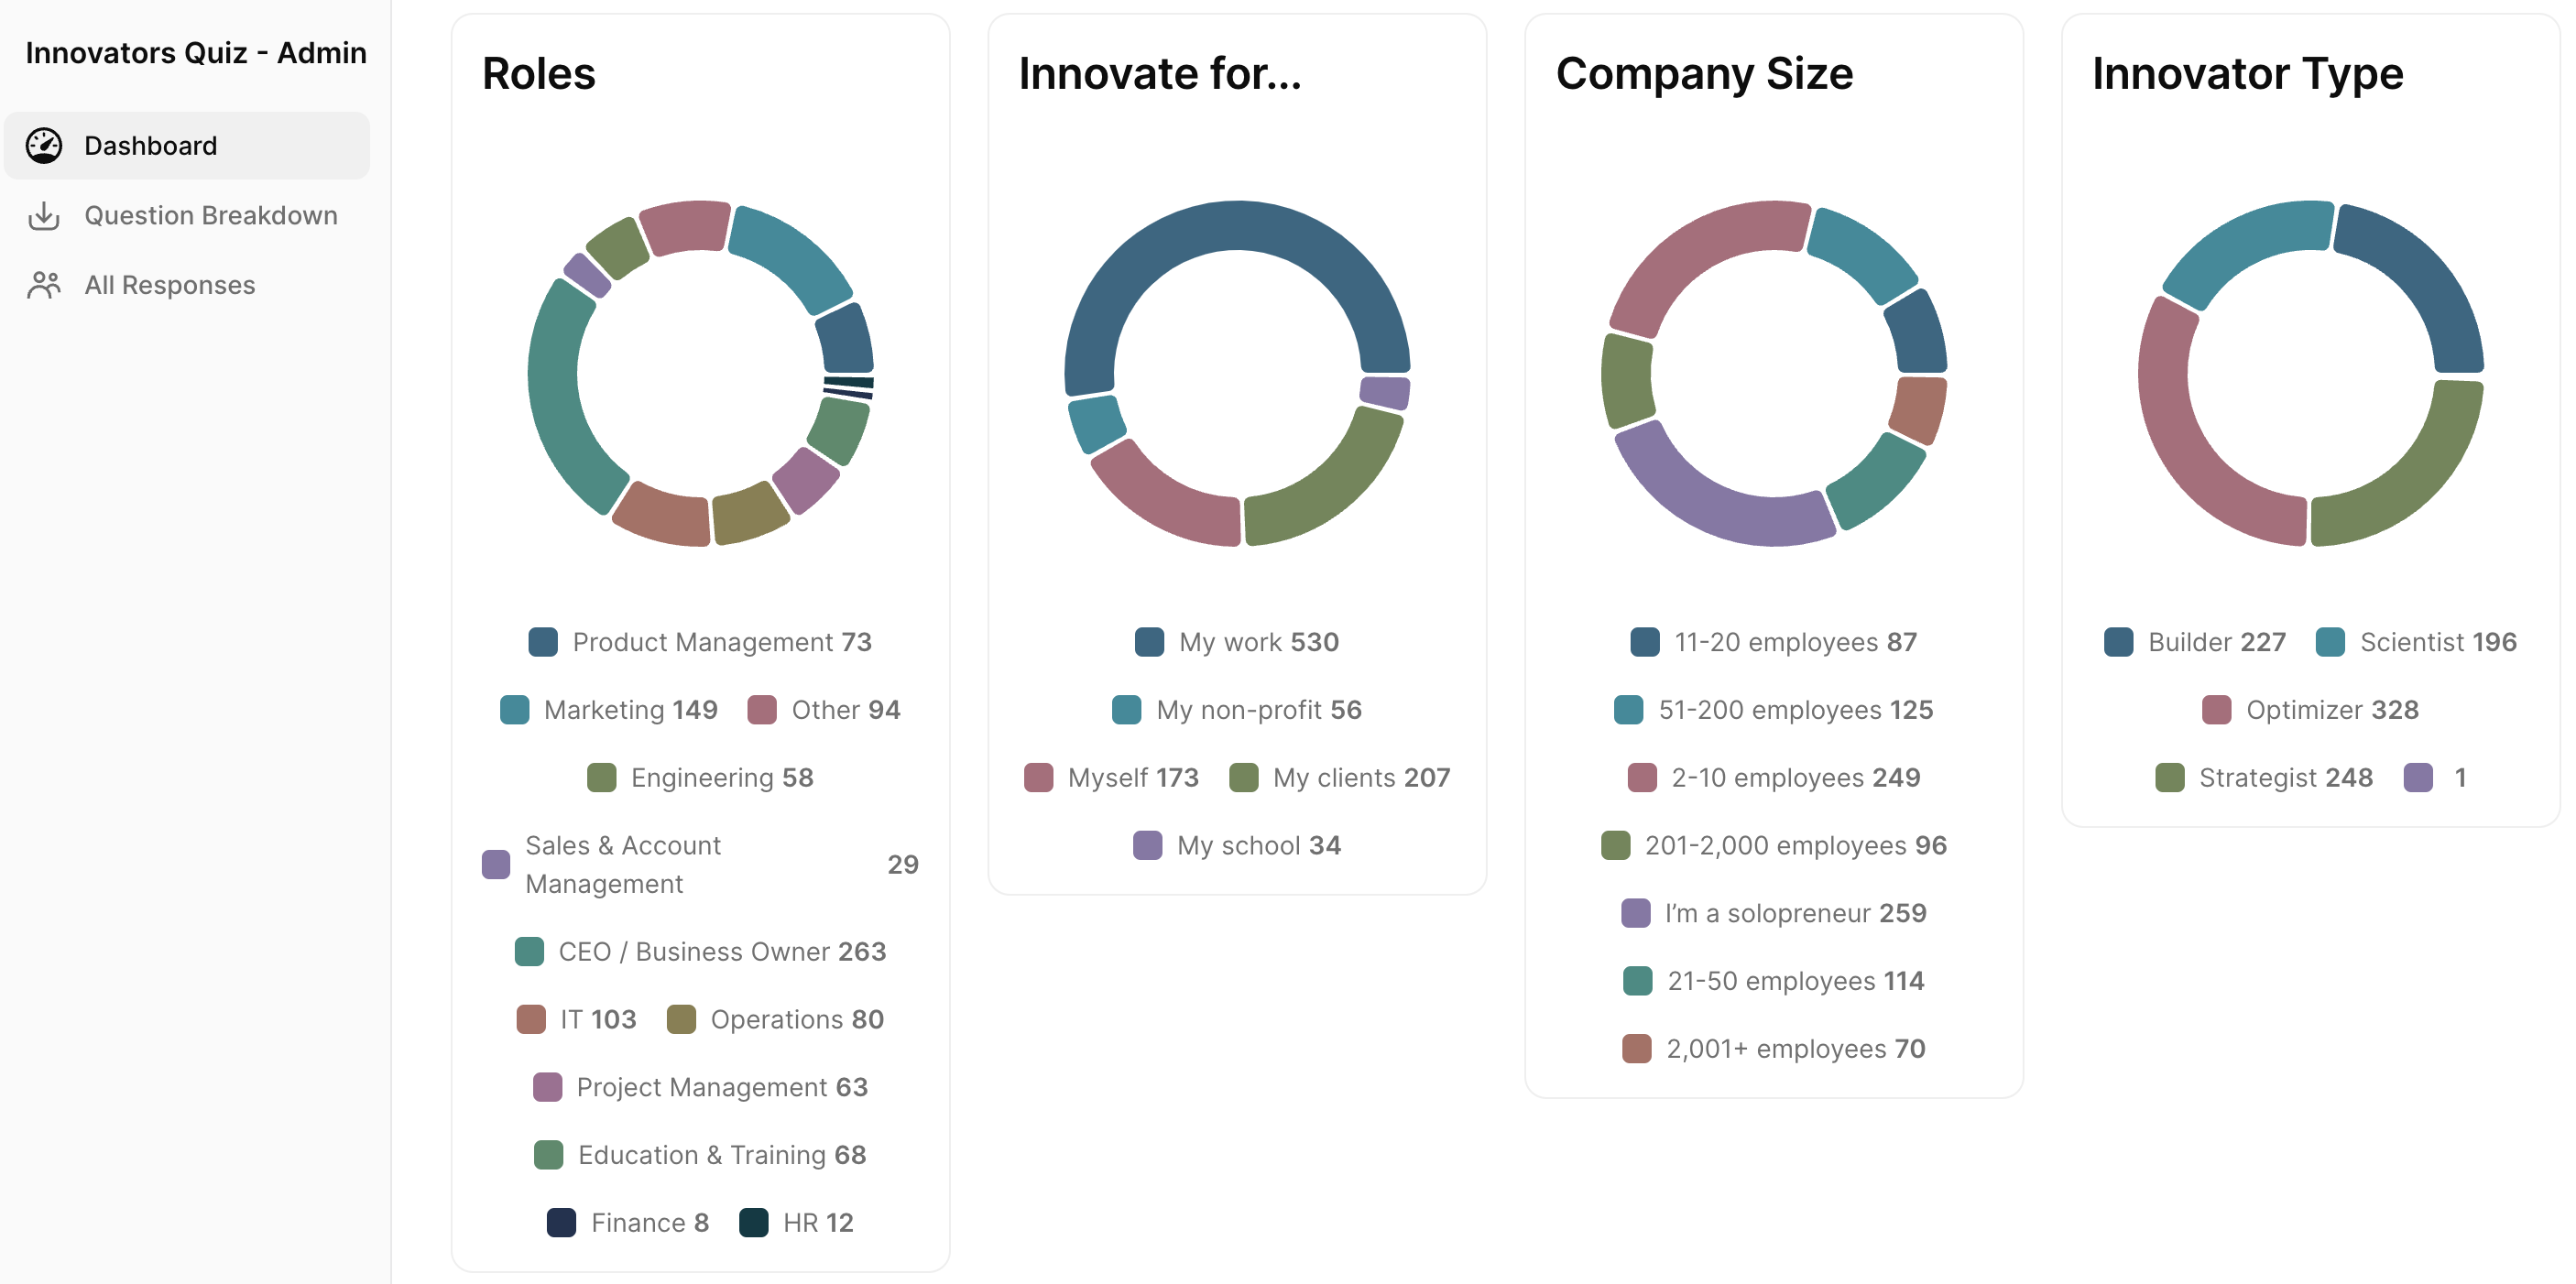
We created a second app to monitor the results of the assessment. This admin dashboard lets us see the breakdown of responses at a glance. Because the app resides in the same team as the quiz app, it can pull from the same data. There are three screens in this app: a dashboard, a breakdown by question, and a table of all respondents.
Dashboard screen: Big Number components to show us how many assessments were started versus completed. Radial Chart components to show the Quiz Segmentation breakdown of completed assessments.
Question breakdown: Uses Radial Chart components showing the answer breakdown by question. Questions are grouped into containers for each quiz section.
All Respondents: Uses the Data Grid component to show a summary of everyone who took the quiz. We enabled the collection search and filter options to drill down by company size and role. This helped us identify the calculation issues early on. As we iterated on the dashboard and exposed more information, it helped us spot interesting trends and outliers that we wouldn’t have seen otherwise.
Takeaways: Applying this at work
One of my biggest takeaways from this project was that the magic is in the details. Seriously… It gave me a new appreciation for what you can do in a details screen.
Collections and collection detail screens are a Glide superpower. A detail screen can do so much more than just display the values stored in a table row.
For the innovators quiz app, we used computed columns and conditional logic to load dynamic, personalized results for each person who took the quiz. We built it once, and it scaled to thousands of entries.
You can apply the same concepts to your Glide apps.
Let’s say you’re building an app for employee performance management. You can use these same methods to change what’s shown based on what’s in your employee data. Depending on your employee’s performance score in different areas, you could have different recommendations that cater to those scores. Then, their manager can leave additional notes or comments to supplement the recommendations.
Tips for others
Like any platform, you’re dealing with certain constraints when you’re building in Glide. Rather than trying to change those constraints or push against them, try coming at it from a different perspective. How can you leverage what’s available? How can you embrace these capabilities?
That’s what I did when I blew up the quiz a couple days ahead of launch. I was trying to make Glide work in a way it wasn’t designed for. I was coming in loaded with biases and opinions from how I worked with other platforms.
When I stopped trying to do that, when I started thinking in Glide terms, it made things a lot easier, and it made building the app a much more enjoyable experience.
Final thoughts
The Innovators at Work assessment was a fantastic learning experience for the whole team. There were lots of moving parts to it and a lot of deep research and prep work. I appreciated getting the chance to dive in and build this from scratch.
We were able to pull this together under a very tight deadline, especially considering I blew the whole project up a couple of days before going live. But even that, in hindsight, gave me a better understanding of how to build Glide apps.
If you’ve been inspired to try something new and innovative in Glide, please share it in the Community. I’m excited to see what you build!


