Retail Media Measurement Hub
Measure retail media from spend to incremental lift
Preview



Overview
Why marketing teams use it
Retail media budgets are growing fast, but measurement is fragmented. Campaign pacing lives in one tool, attributed revenue in another, and incrementality results in a spreadsheet no one trusts. This app brings everything into one workspace — so teams can move from data to decision without switching tabs.
- Campaign portfolio at a glance. See every active flight's spend, attributed revenue, and ROAS in a sortable, filterable list. Spot overpacing and underpacing campaigns before they become problems.
- Channel placement board. Log and compare placements across Sponsored Search, Display, CTV, Social, In-Store Digital, and DSP. Revenue and impression data is grouped by channel so trade-offs are visible instantly.
- Incrementality experiment registry. Track A/B tests and holdout experiments from hypothesis to verdict. Lift percentage and confidence score surface on every card, with completed results broken out from running tests.
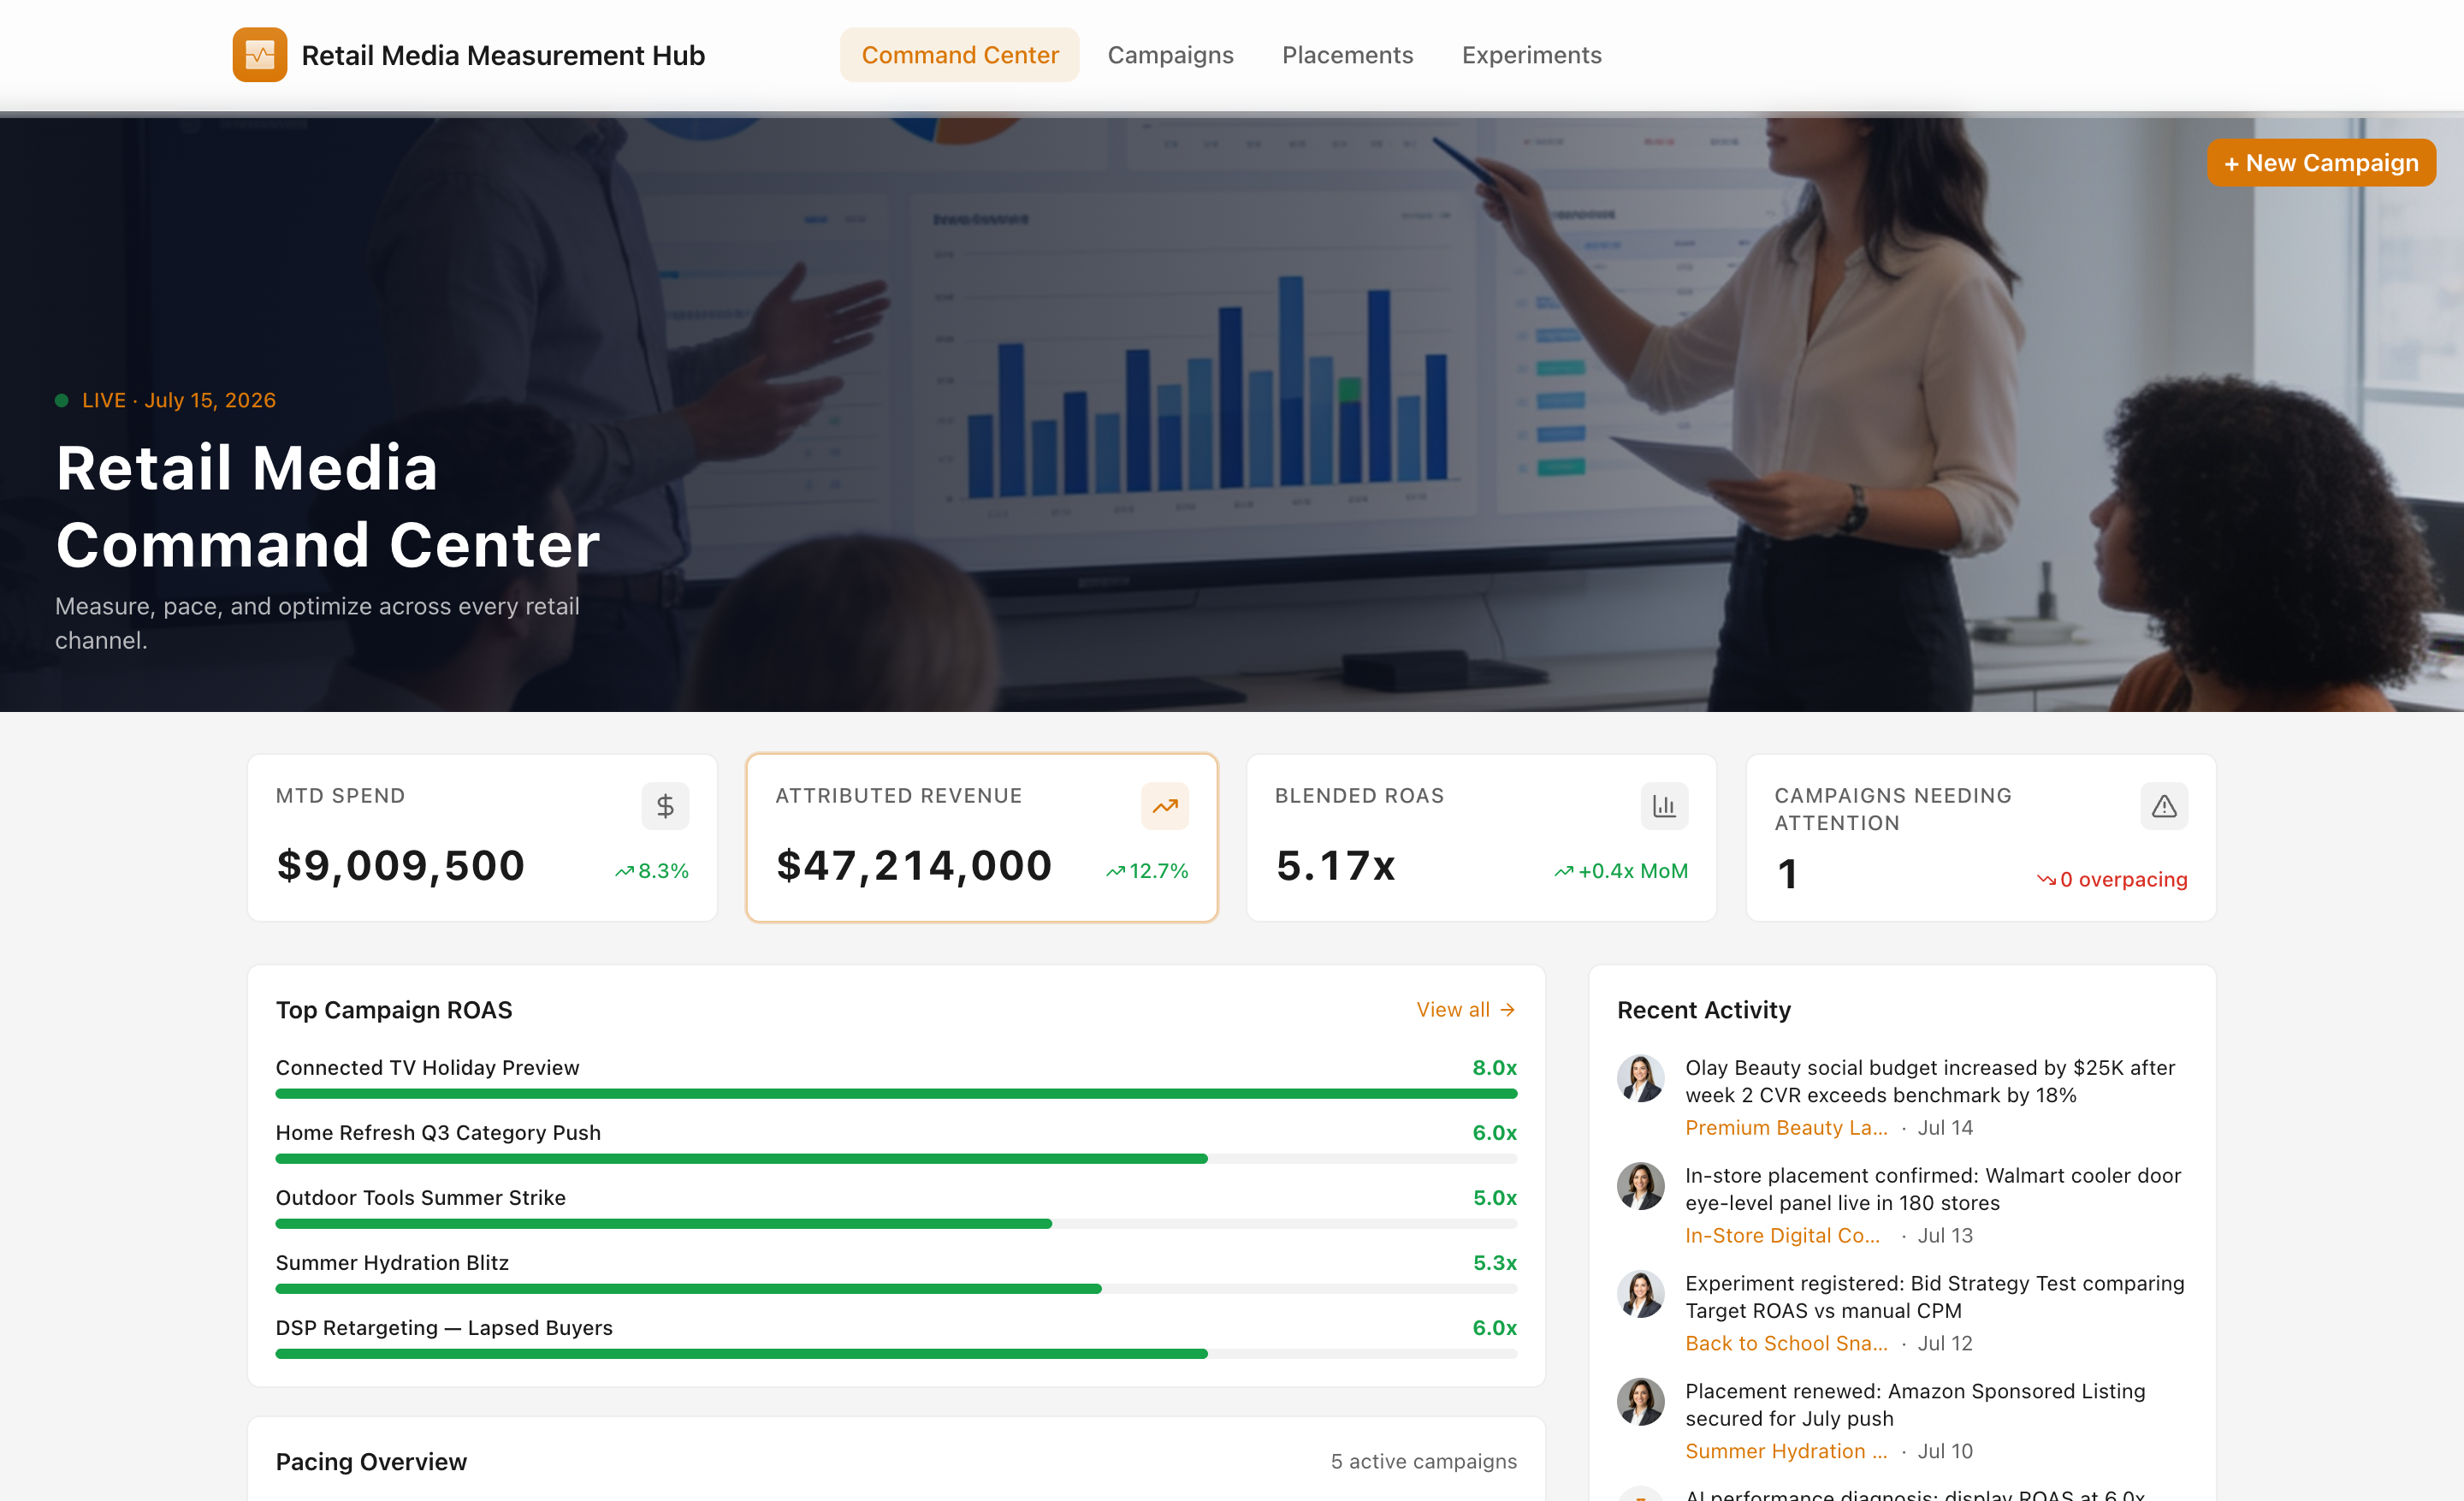
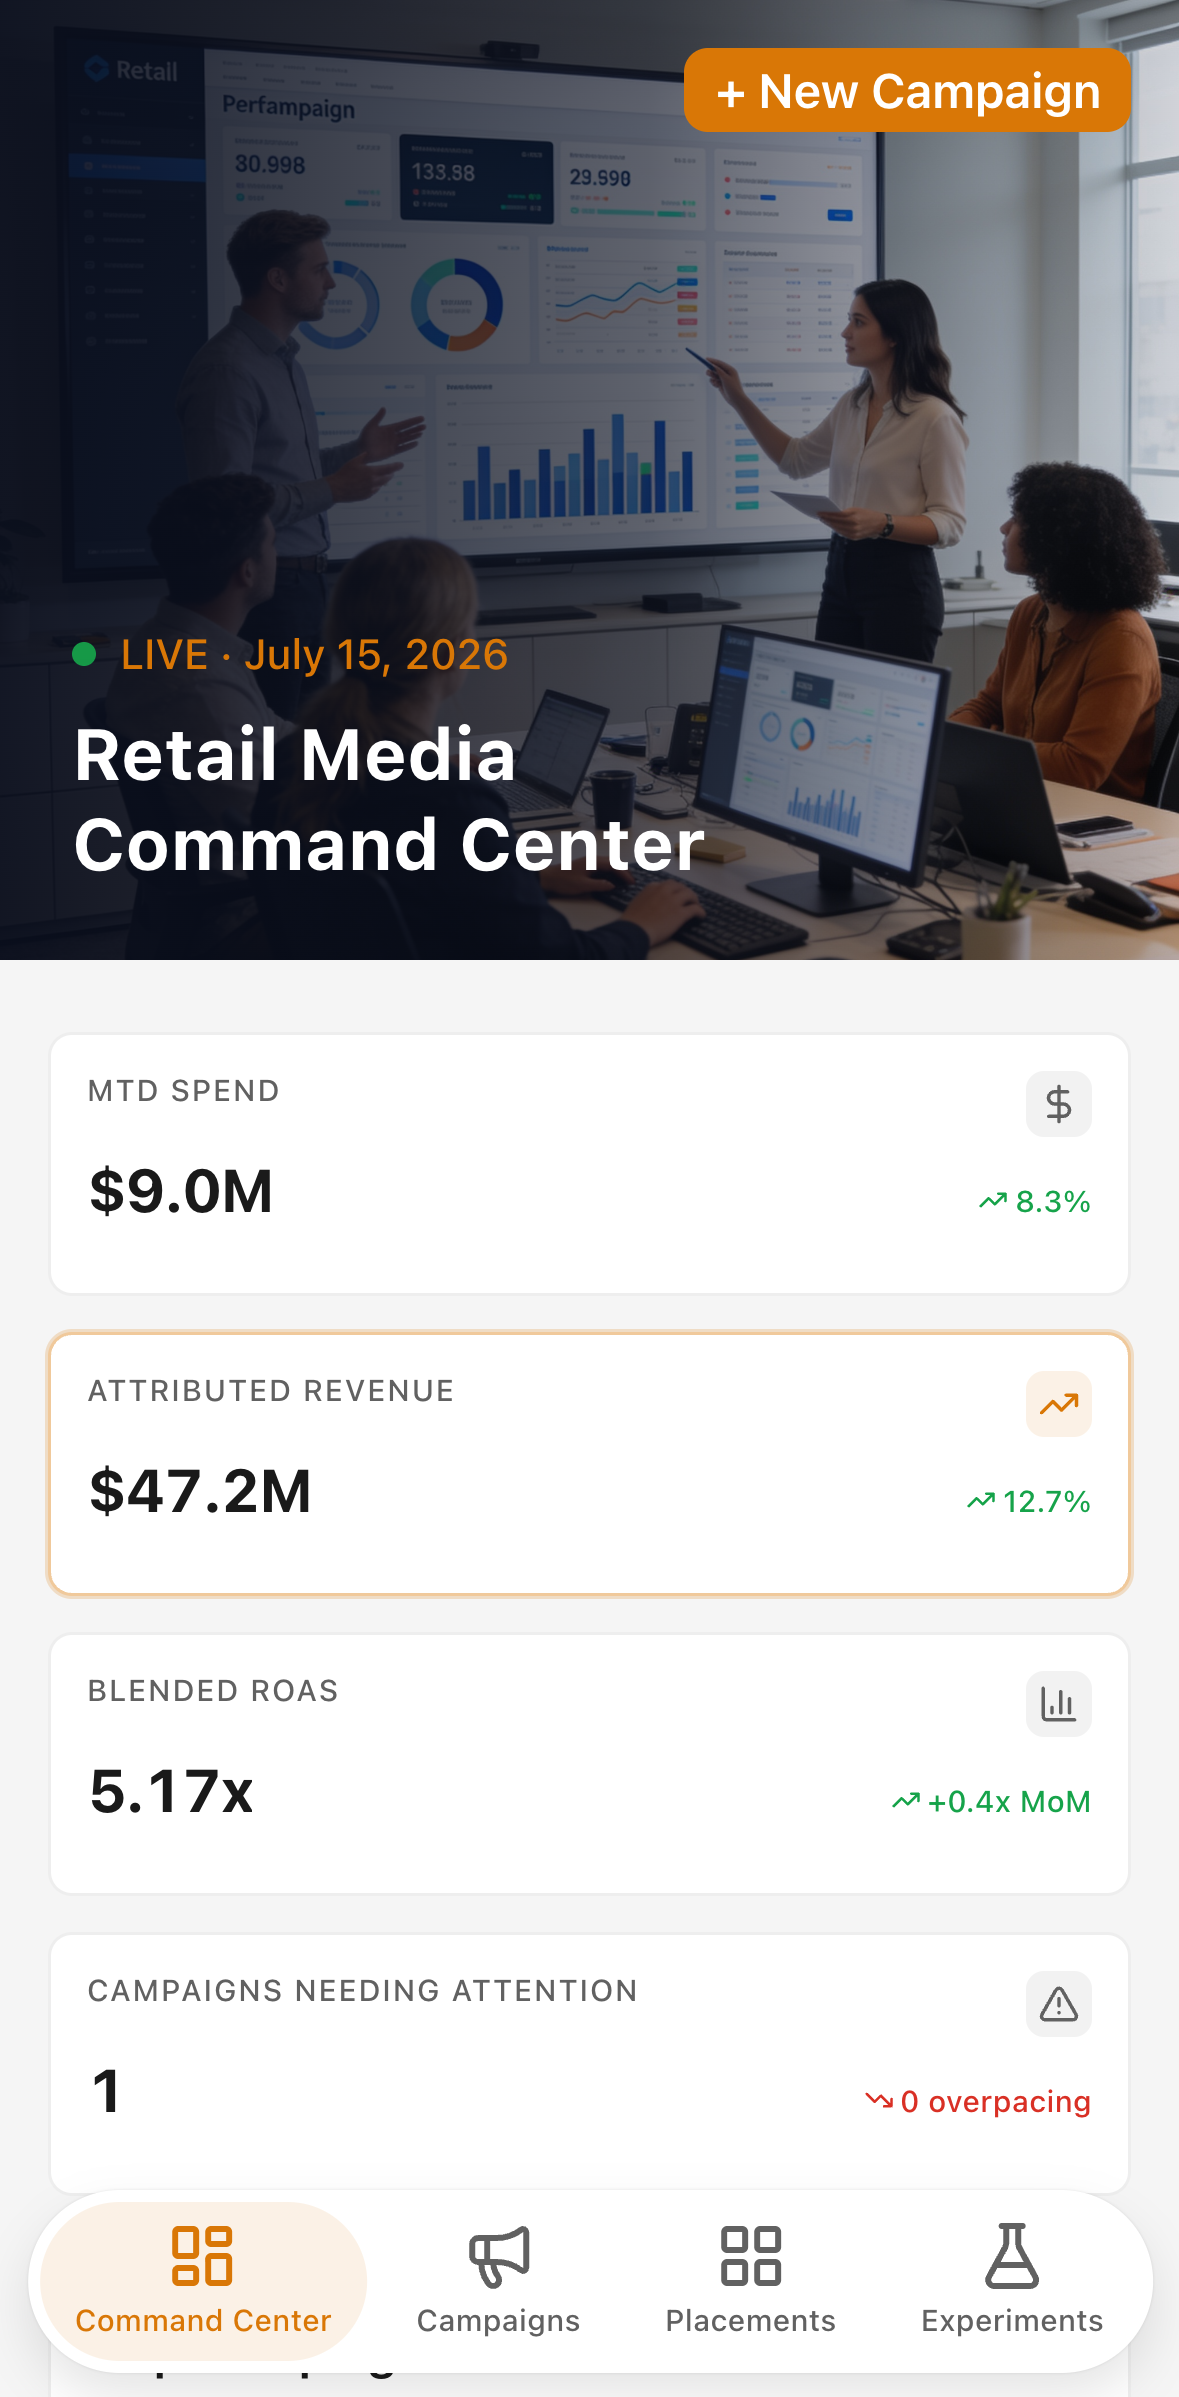
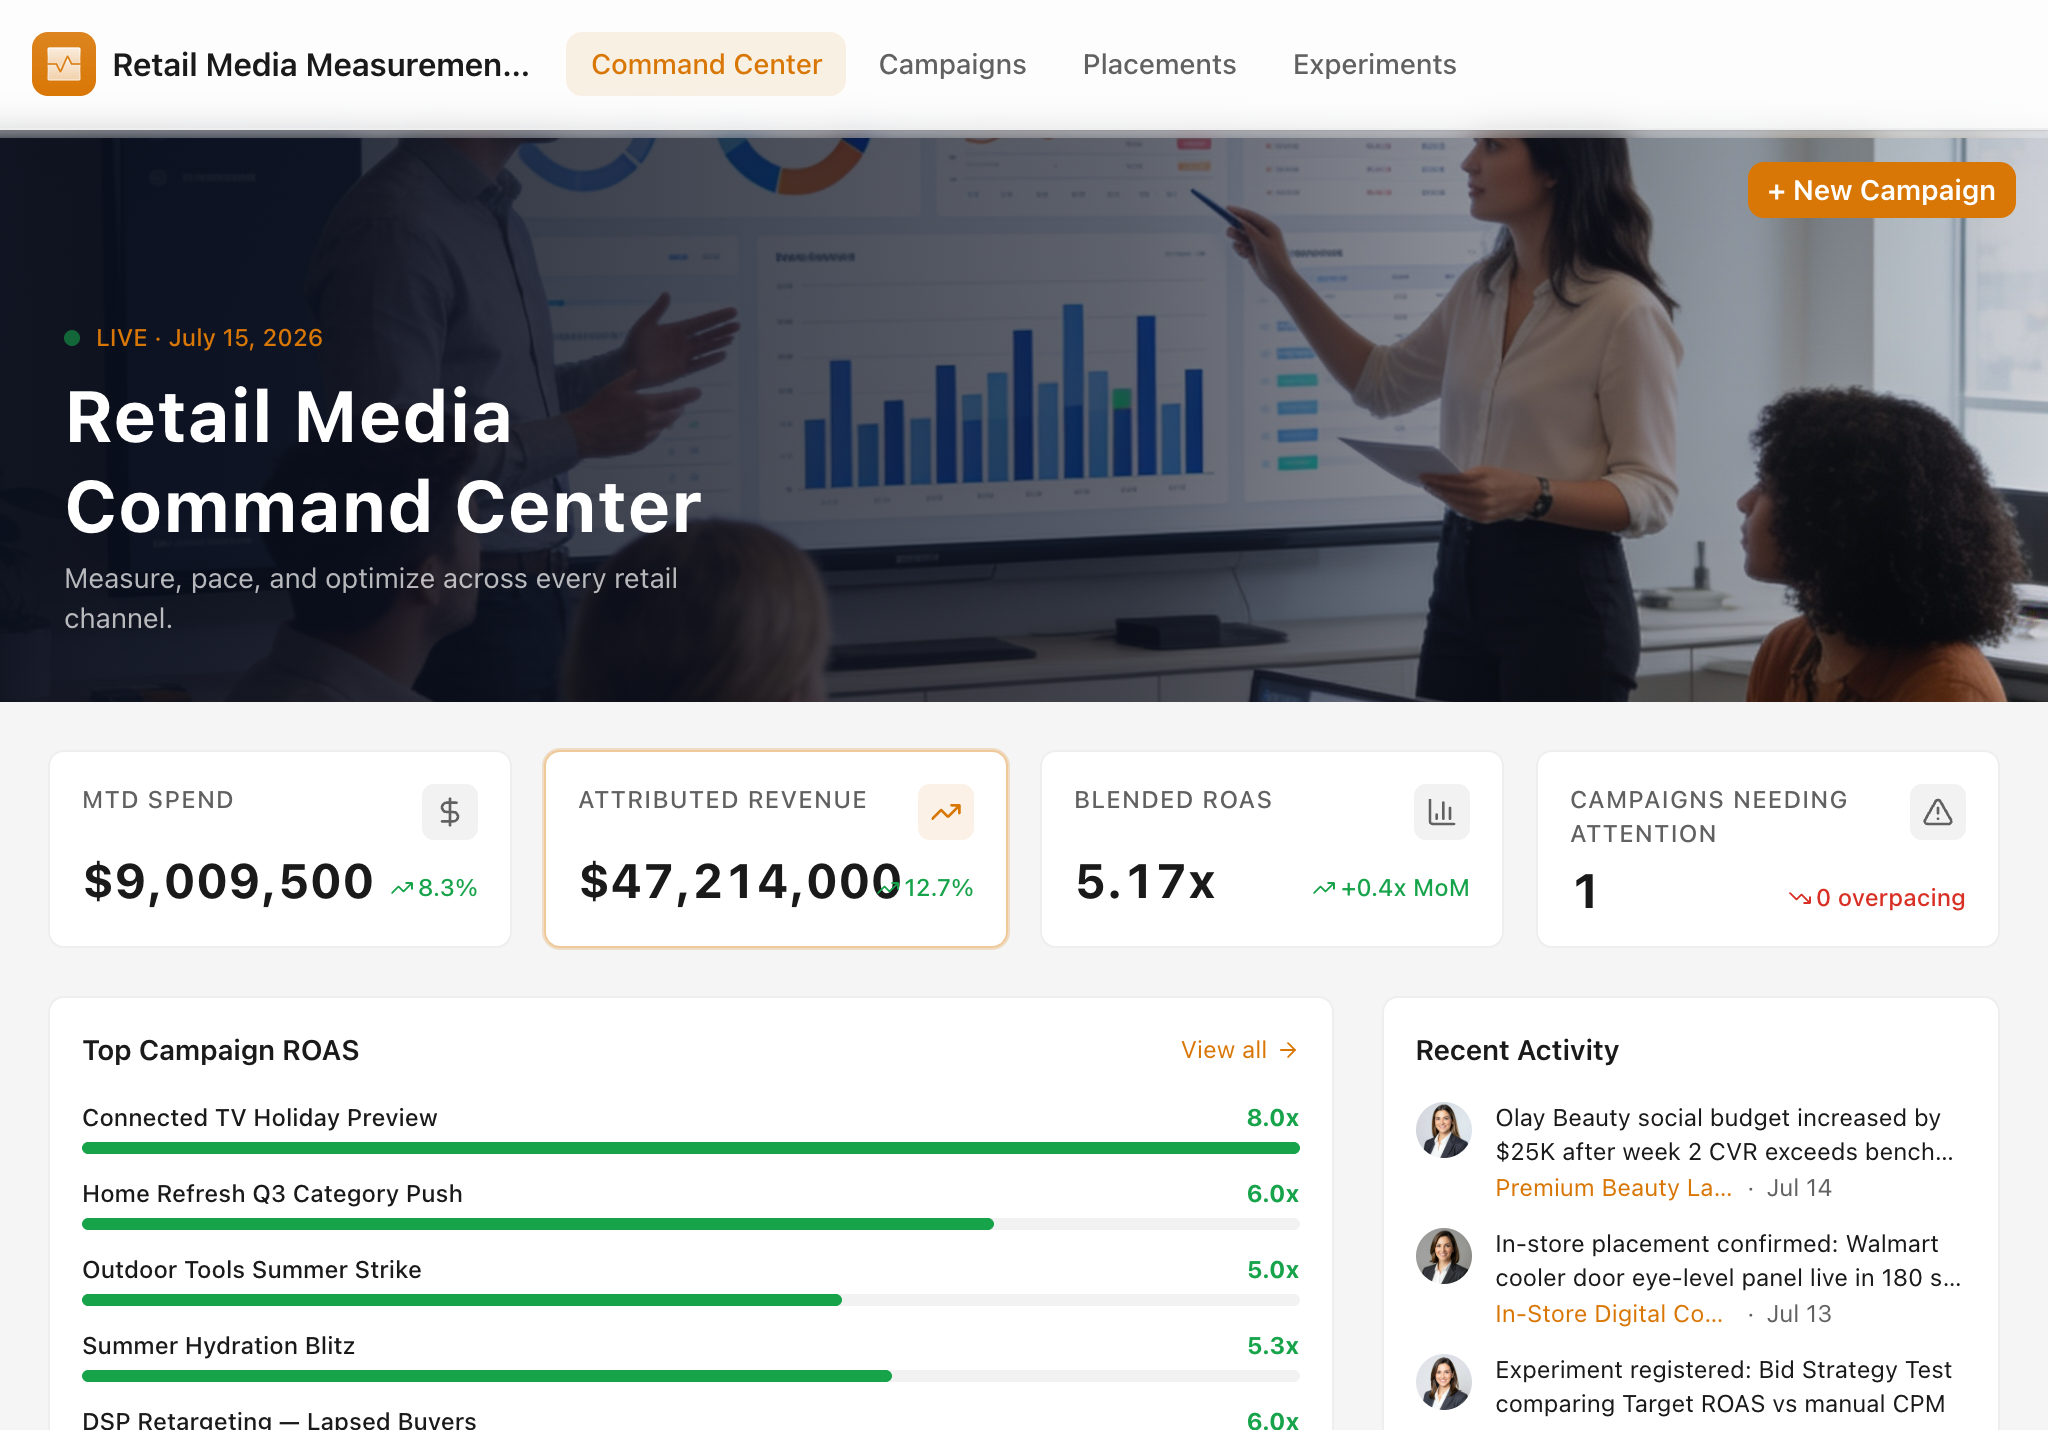
- Executive command center. The landing screen leads with MTD spend, attributed revenue, blended ROAS, and a pacing heatmap — the four numbers a CMO or trade marketing director asks for first.
AI: Explain performance
The Explain performance action appears on the campaign detail screen, pinned to the right column alongside the activity feed.
Input. When triggered, it sends the campaign's full measurement context to the AI model: campaign name, brand, retailer, and channel; current spend and total budget; attributed revenue; ROAS (actual vs. target); budget pacing percentage and pacing status (on track, overpacing, or underpacing); click-through rate; conversion rate; cost per acquisition; days remaining in the flight; and the campaign objective. If the campaign has linked experiments, their lift and confidence results are available in the same context.
Output. The model returns a concise, structured diagnosis — typically three to five sentences — followed by a Risks bullet list and a Next Actions bullet list. Risks call out what could go wrong if the trajectory holds (e.g. overspend before the flight ends, ROAS degradation from frequency fatigue, budget left undeployed). Next Actions are specific and executable (e.g. reduce daily cap by 15%, shift budget to the placement with the highest attributed CVR, extend the flight window to fully deploy remaining budget).
Where it appears. The action button appears on the campaign detail experience, accessible from the command center's top campaigns list or the campaign directory. It is also surfaced as a logged event in the campaign activity feed after each run, so the team can see when a diagnosis was last generated.
Buyer outcome. Brand managers and trade marketing directors use it to accelerate two conversations that historically take days: the weekly budget reallocation decision and the incrementality readout with a retailer partner. Having a written diagnosis grounded in live pacing and revenue data means teams enter those conversations with a clear point of view rather than a spreadsheet walk-through. The result is faster budget decisions and clearer incrementality conversations with fewer back-and-forth cycles.